Advanced Serial Data LoggerTrust In Confidence! For Windows 2000 - Windows 11 (2022) (incl. Server, x86 and x64). Latest version: 4.7.7 build 417. April 17, 2024. Export data and update charts in Excel in real-timeDownload a Free Trial Version. It allows you to try all features! Plugins can be downloaded separately here
Problem scenario: I want to connect an RS-2322 port to MS Excel. The port will provide a stream of ASCII numeric characters to Excel. I want Excel to automatically receive and graph the ASCII data, sort of like an oscilloscope. I can control the format of the incoming ASCII data. Requirements:
It is assumed that: You've prepared parser items for export. You can work in Microsoft Excel, specifically create charts in an Excel file. For this tutorial, all items were prepared in the previous part. Also, you may read other examples:
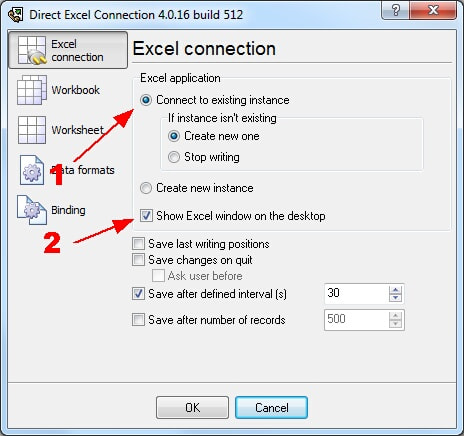
Solution: All parser items are now ready for export to the "Direct Excel Connection" plugin. Please, open the configuration window of the "Direct Excel Connection" plugin (fig.1) by selecting the module in a list and clicking the "Setup" button on the "Data export" page.
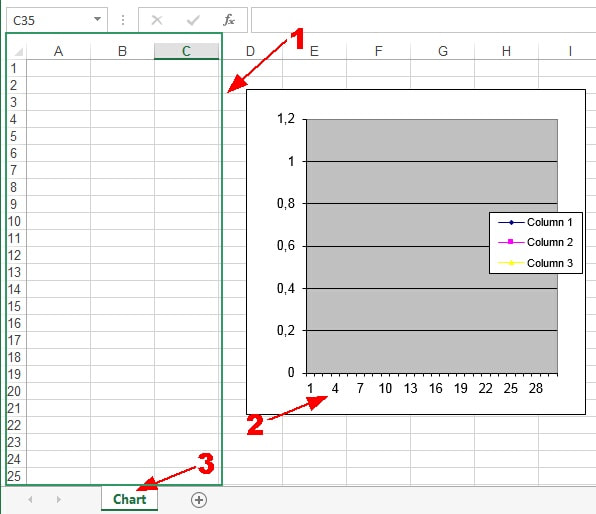
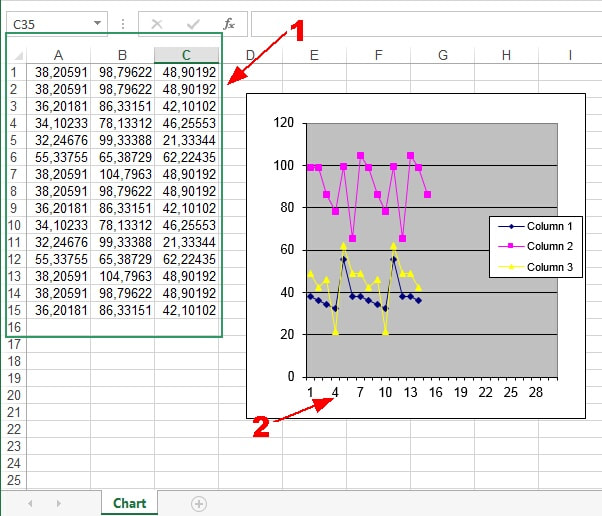
Then select options in field #1 and field #2. These options will allow you to start Excel and display it on your desktop. Excel will be started automatically on program start. Because we want to draw a chart in a real-time environment, then we should prepare an Excel file before the next step. In this example, we've created a diagram with three plots. Each plot is based on data from columns A, B, or C. We'll place FLOW1, VOLW1, and TEMP1 to columns, and the chart will use these values and automatically redraw every time. We'll use the last 30 values on the diagram only.
The figure above contains the following elements:
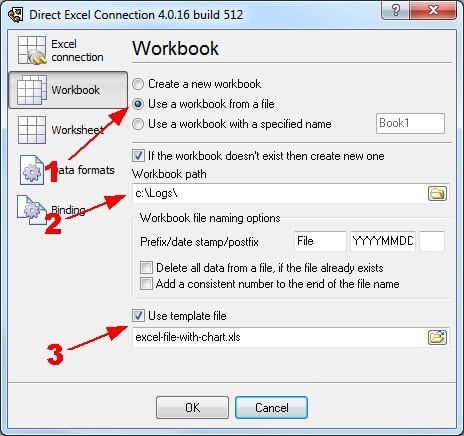
The Excel file, which we've created you can download here and use it in your work. In the next tab, you should specify your workbook options as per your requirements (real-time charting).
You should select the "Use a workbook from a file" option (fig.3 pos.1) to use an existing file and write data to this file. The path and name of this file you created before (fig.2) should specify in field #2. The option at the position 3 allows you to save all the written data when the program exits.
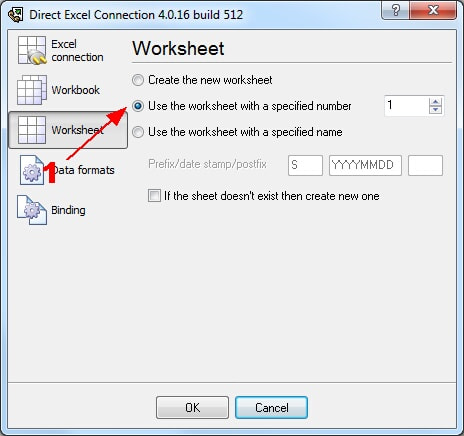
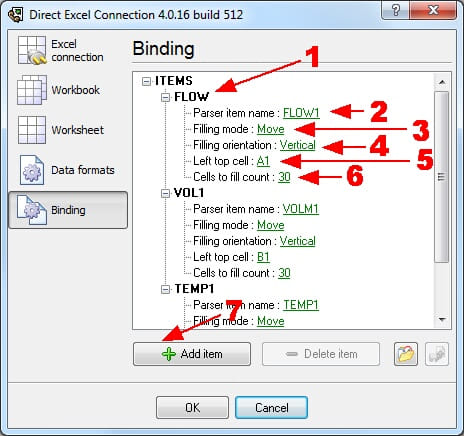
In the next tab, with the help of the option at the pos. 3, you should specify your worksheet number in the workbook. We've created the workbook, where the worksheet is first. Therefore we've specified this number on the "Worksheet" page. The last "Binding" page (fig.5) is significant. The column description and column position that you require to be bound to the variable's names that are specified on this page.
Any new items may be added by clicking the "Add item" button (Fig.5, pos. 7). Before adding an item, the program will ask you about an item description. You can type any characters here, which will help you to remember a variable's content. For this example, three variables with their corresponding descriptions have been added. Each data export item has several properties:
Click the "OK" button and close the Direct Excel Connection plugin configuration window and the "OK" button in the options window. Okay, all settings have been completed, and we are ready to capture data to an Excel file. If the data export module and the parser had been correctly set up, you should see real-time drawing in Microsoft Excel (fig.6).
The figure above contains the following elements:
The Excel file with all values and plots you can download here. Related articles:
|
|
| Copyright © 1999-2024, AGG Software. All rights reserved. Terms of use | Privacy policy |