The program does not contain preset reports and allows you to create them at your request. You can configure the report parameters and add a customized report to your favorites, thus making your list of reports with individual parameters.
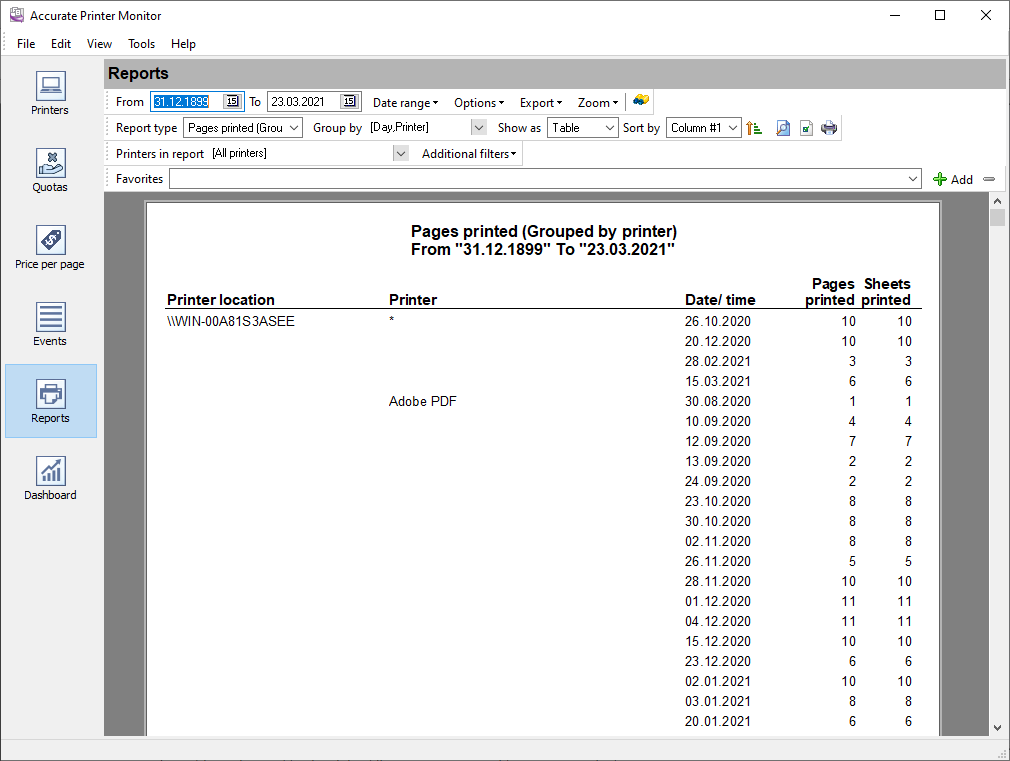
Fig.16 Report page
Date range. These options allow you to select a preset date range for the report. If you need to build a report for a certain interval, you should specify it in the "From" and "To" fields.
Report type
1.Detailed. It is a detailed report by events. It contains the main information about events. If you select this report type, the other options are disabled.
2.Detailed (columns from Events page). It is the same as the previous report, but the report contains the data that is currently displayed in the table on the "Events" page. This way, you can include only the data that you want to view in the report.
3.Bytes printed - the report with data about the number of bytes sent to the printer.
4.Pages printed - the report about the printed pages.
5.Bytes and pages printed. This report contains the number of both printed bytes and printed pages.
6.Pages printed + cost. The report is the same as #4, but the print cost is calculated. The print cost calculation considerably influences how fast the report is built.
7.Bytes and pages printed + cost. It is the same as #5, but the print cost is calculated.
8.Printer failures. The report contains errors retrieved from printer drivers or via SNMP. The report may include messages about low toner level, paper out, opened printer cover, etc.
9.Cartridge: Toner level. The report works only for network printers with the SNMP monitoring option enabled. The program retrieves and logs information about a toner level. If a printer has color cartridges, the program stores info about these cartridges too. The report shows the last received toner level for the select time interval. Please, note, only a limited number of printers support SNMP monitoring. Sometimes, you should enable it in the printer settings.
10.Cartridge: Serial number. The program can retrieve a cartridge's serial number with a toner level. The report allows you to get a history of cartridges replacement. Please note that the cartridge data's storage depth depends on the storage depth of the event data.
11.Quotas: List. This report allows you to get info about all active quota rules.
12.Quotas: Used PIN codes or passwords. This report shows usage statistics of PIN codes or passwords defined in quota rules.
Group by - here, you can select one or several fields for grouping the data.
Show as - allows you to select the report view.
•Table - table view.
•Graph - graph view.
•Histogram - histogram view.
•Pie - pie chart view.
•Linear - linear graph view.
•Dot - dot graph view.
•Region - a graph by regions.
Sort by. This option allows you to sort data by the necessary column. Columns the data is grouped by come first in the list.
Options
•3D view - 3D graphs.
•Colored - color graphs.
•Show legend - show the legend on graphs.
•Show axis - show the axes on graphs.
•Single - show one graph for all values.
•Top 10 only - show only the first 10 values.
•Ascendant sorting - sort in the descending or ascending order.
•Marks - enable marks for each value on the graph that can contain a value or mark.
A change in most report parameters will trigger a 10-second timer, and the report will be automatically updated after that. You can also update the report with a click on the ![]() toolbar button.
toolbar button.
You can print the generated report with a click on the ![]() toolbar button or export it to a file using the "Export" menu.
toolbar button or export it to a file using the "Export" menu.
You can get any report by combining the above parameters.
Report preferences
If the generated report does not fit on one page, you can:
1.Change the size and format of the page with a click on the ![]() toolbar button.
toolbar button.
2.Change the font that is used in the report and its size. To do it, select "Options - Additional..." and specify the necessary parameters in the new dialog box (fig. 17).
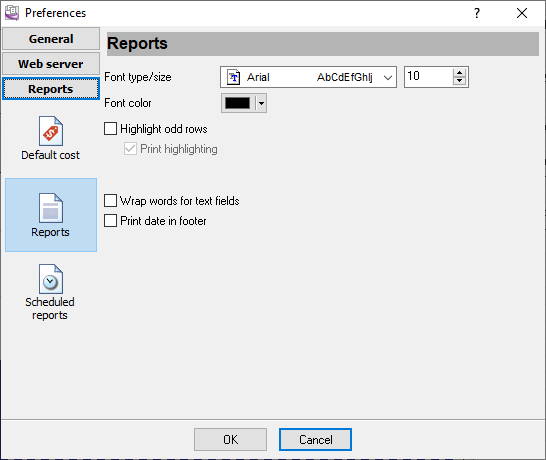
Fig. 17 Report page
Font type, Font size, Font color. These options allow you to select a font type to be used in the report.
Highlight odd rows. It allows you to enable highlighting odd rows in the report. If it is enabled, odd rows will be shown with the background color specified below.
Print highlighting. If this option is enabled, the printed report will be highlighted. Otherwise, only the preview will be highlighted.
Wrap words for text fields. If the value of a column in the report larger than its width, and this option is enabled, the height of the row will increase and part of its value will be moved to the next line. Otherwise, the value will be trimmed according to the column width.
Print date in footer. If this option is enabled, the program will print the page number and the current data in each page's footer.
Creating the list of favorite reports
To add a report to your favorites:
1.Configure the report as described above.
2.Generate the report.
3.If you are satisfied with the generated report, click the ![]() button next to the list of favorite reports.
button next to the list of favorite reports.
4.The program will offer you to specify the report name. You can specify any name.
5.Click OK after you type the report name, and the report will be added to the list of favorite reports.
To remove a report from the list, you should click the button: ![]()