OPC Scada Viewer - Online help | OPC Scada Viewer
About
The family of the OPC software technologies is a unified interface for controlling automation objects and technological processes. Most gauges, monitoring and control devices nowadays have OPC servers that can be used to obtain the current data. OPC Scada Viewer supports the main and most widely used OPC DA1 and DA2 standards that allow you to exchange data with programmable logic controllers, human-machine interfaces, computer numerical controlled devices and other devices in real time.
OPC Scada Viewer allows you to easily and very visually display data received via the OPC interface. Data is displayed in real time, which allows you to use the program for permanent control and monitoring in various systems. OPC Scada Viewer offers a lot of indicators for displaying the values of OPC tags, from simple analog pointer indicators to charts and diagrams. It is possible to customize every indicator separately for your needs.
OPC Scada Viewer main features:
•Retrieving data from one or several OPC servers simultaneously;
•Displaying the value of an OPC tags with the help of a wide range of indicators;
•Different indicators for different types of OPC tags (logical values, strings, integers and fractions);
•Customizable visualization parameters for each indicator;
•Creating several tabs with different sets of indicators;
•Using any image as the background image for indicators;
•Visual and sound warnings when an OPC tag exceeds the specified limits;
•Automatically controlling a connection to the OPC server and keeping it alive;
•Supporting all Windows version starting from Windows 95.
The program is easy to use! The configuration process is completely visual and has full context help. You can completely customize the application.
Typical use
A good example of using the program is replacing a large and cumbersome SCADA in a system where it is necessary to only control and monitor and where there is no need to send any commands back.
Sample applications
•Data log systems.
•Remote monitoring systems.
•Alarm and warning systems.
Company home page: https://www.aggsoft.com/
Software home page: https://www.aggsoft.com/opc-scada-viewer.htm
Glossary
Bit - Binary digit in the binary numbering system. Its value can be 0 or 1. In an 8-bit character scheme, it takes 8 bits to make a byte (character) of data.
Bytes - A collection of eight bits that represent a character, letter or punctuation mark.
Cable - Transmission medium of copper wire or optical fiber wrapped in a protective cover.
Client/Server - A networking system in which one or more file servers (Server) provide services; such as network management, application and centralized data storage for workstations (Clients).
DA – data access.
Internet - A global network of networks used to exchange information using the TCP/IP protocol. It allows for electronic mail and the accessing ad retrieval of information from remote sources.
IP, Internet Protocol - The Internet Protocol, usually referred to as the TCP/IP protocol stack, allows computers residing on different networks to connect across gateways on wide-area networks. Each node on an IP network is assigned an IP address, typically expressed as 'xx.xx.xx.xx'.
IP address (Internet Protocol address) - The address of a computer attached to a TCP/IP network. Every client and server station must have a unique IP address. Client workstations have either a permanent address or one that is dynamically assigned to them each dial-up session. IP addresses are written as four sets of numbers separated by periods; for example, 198.63.211.24.
LAN (Local Area Network) - A network connecting computers in a relatively small area such as a building.
OPC (OLE for Process Control) – a set of universally accepted specifications providing a universal data exchange mechanism in control and management systems.
OPC Alarms and Events - the OPC interface for access to alarm and event data.
OPC Data Access - the OPC interface for access to real-time data.
OPC DA - see OPC Data Access.
OPC Historical Data Access - the OPC interface for access to archived data.
OPC HDA - see OPC Historical Data Access.
PC - abbreviation for a Personal Computer.
TCP/IP, Transport Control Protocol / Internet Protocol - TCP and IP are communications protocols, that is, structured languages in which data is communicated between one process and another, and between one network and another. TCP/IP is implemented in a multi-level layered structure. TCP/IP is the 'glue' that that ties together the many heterogeneous networks that make up the Internet.
System requirements
Windows 2000 Professional - Windows 10 (2019), including x64 and x86 OS, Workstation, and Server OS.
It is necessary to have at least one free COM port, not busy by any device (mouse, for example) to connect an external device.
Installation process
If any beta-version was installed on your computer, remove it.
Quit of the working OPC Scada Viewer on installation time.
Run an installation file.
By default, the installation wizard installs OPC Scada Viewer in the "C:\Programs Files\OPC Scada Viewer" or "C:\Programs Files (x86)\OPC Scada Viewer" directory of your system disk, but you can change this path.
In the standard distributive of OPC Scada Viewer are no additional modules files, which you can download from our site.
Introduction
Main features
•Viewing data from one or several OPC simultaneously.
•Displaying the value of an OPC tags with the help of various indicators.
•Different indicators for different types of OPC tags (logical values, strings, integers and fractions).
•Customizable visualization parameters for each image.
•Creating several pages with different sets of indicators.
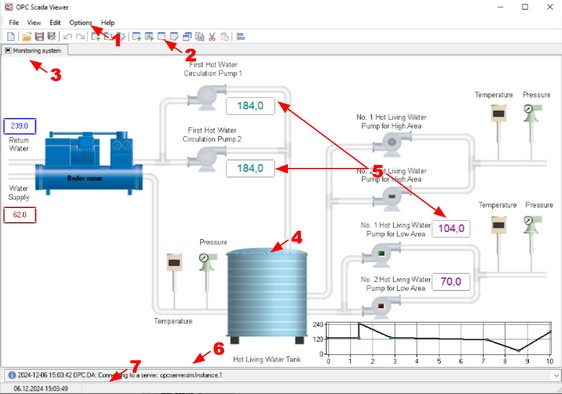
The main window of the program is displayed on the screen after the program is started (fig. 1). The image below shows the features of the program and explains what this or that part of the window is for.
Interface
1.Menu bar - the main menu of the program described in the "Menu" section.
2.Toolbar - this bar contains buttons for the most frequently used features.
3.Tabs where you can put together several indicators as a group. You can use the "Edit - New Tab" menu item to add a new tab.
4.The background image that may contain a technological process. You have to prepare the background image in another program.
5.Indicator - it shows the current value of the OPC tag in this or that form. You can find how to create and configure indicators in the "Visualization block" section.
6.The log bar of the program where you can see messages about current operations.
7.Status bar - it shows the current time, the status of the program or the current operation.
Most menu items and toolbar buttons have a tooltip. For example, if you move the mouse pointer over a toolbar button, you will see a tooltip (fig. 2).

Fig. 2 Interface item tooltip
First steps
To configure the program, you should:
2.Add one or several indicators on the tab.
3.Configure the parameters of each indicator.
Introduction
The main menu is located on the menu bar you can move anywhere on the screen. The menu consists of the following items: File, View, Edit, Options, Help. Each menu is described in the corresponding section below. You can open some menu items using keyboard shortcuts or toolbar buttons. By default, the toolbar is located below the menu bar and can also be moved anywhere on the screen.
Some most frequently used menu items are available on the context menu you can open with a right click on an object.
Information about keyboard shortcuts for each menu item is given in the corresponding section. A keyboard shortcut given as "Ctrl+N" means that you have to press and hold down the Ctrl key simultaneously press the N key.
File menu
Open
Keyboard shortcut: Ctrl+O
Toolbar button: ![]()
Open the project file that was saved before to a file with the ".xml" extension. All tabs with visualization blocks are closed once it is loaded.
Save
Keyboard shortcut: Ctrl+S
Toolbar button: ![]()
Save the parameters of tabs and visualization blocks on them to a file with the ".xml" extension.
New configuration
Keyboard shortcut: Ctrl+N
Toolbar button: ![]()
Delete all tabs and visualization blocks on them and get the program ready for a new project.
Exit
Keyboard shortcut: Alt+F4
Toolbar button: ![]()
Close the program. When you exit the program, all parameters of the current configuration are saved in the registry, and it will be loaded next time you start the program.
This menu item also contains the list of recently opened files to make it comfortable for you to switch between different projects.
View menu
You can use this menu to select which interface items should be shown and which ones should be hidden. In particular, you can show or hide the main menu, the toolbar or the log bar.
Edit menu
Undo
Keyboard shortcut: Ctrl+Z
Toolbar button: ![]()
Undo the last operation of moving or deleting visualization blocks and deleting tabs. The program remembers 100 last operations that you can later undo. After you load a configuration from a file, the list of operations you can undo is cleared.
Redo
Keyboard shortcut: Ctrl+R
Toolbar button: ![]()
Redo the last undone operation of moving or deleting visualization blocks and deleting tabs.
New Tab
Keyboard shortcut: Ctrl+T
Toolbar button: ![]()
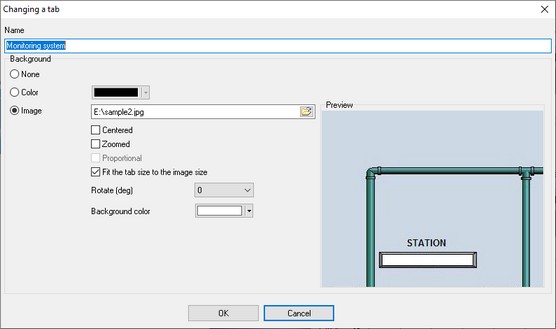
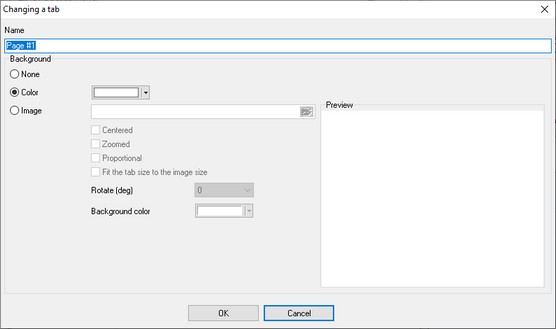
The command adds a new tab you can put visualization blocks on. Once you select this item, you will see the Tab Parameters dialog box (fig. 3).
You can specify the name that will be displayed on the title of the tab and also select the background type:
1.None - the tab will have no background image and will use the default background color.
2.Color - the tab will have no background image and will use the specified background color.
3.Image - the specified image will be used as a background image over which visualization blocks will be placed. Our program has no built-in tools for drawing graphical elements displaying a technological process. However, you can do it in any other graphics editor.
You can use images of the following formats as a background image: BMP, JPG, PNG and GIF.
If you use a background image, you can specify the following options:
•Center - the image will be placed in the center of the tab.
•Fit - the image will be zoomed to fit the tab size.
•Keep proportions - this option becomes available when the "Fit" option is enabled. If the "Keep proportions" option is disabled, the background image will be distorted to cover the entire area of the tab without keeping the proportions. If the "Keep proportions" option is enabled, the image will be zoomed with the proportions kept, but it is possible that there will be margins visible at the sides of the image in this case.
•Fit the tab size to the image size - if this option is enabled, the image will always occupy the entire area of the tab and the program window will be automatically resized to fit the image size. Also, you will not be able to resize the window of the program.
•Rotate - the option allows you to rotate the background image to a specified number of degrees.
•Background color - if you keep proportions while zooming the image to fit the tab size, the areas of the tab that are not covered by the image will be of the specified color.
Delete Tab
Toolbar button: ![]()
This command becomes available after you create one or several tabs using the "New Tab" command. You can use this command to delete the current tab with all its visualization blocks. If you select this command, the program will ask you to confirm the operation before it deletes the tab.
Edit Tab
Toolbar button: ![]()
This command becomes available after you create one or several tabs using the "New Tab" command. The command allows you to open the Tab Parameters dialog box (fig. 3).
New Block
Keyboard shortcut: Ctrl+N
Toolbar button: ![]()
This command becomes available after you create one or several tabs using the "New Tab" command. The command allows you to add a visualization block, which is an indicator, to display the values of an OPC tag (OPC variable). You can find out how to add a block in the "Visualization block" section.
Delete Block
Toolbar button: ![]()
This command becomes available if you select a visualization block on the tab and allows you to delete the selected block. If you select this command, the program will ask you to confirm the operation before it deletes the block.
Edit Block
Toolbar button: ![]()
This command becomes available if you select a visualization block on the tab and allows you to edit the parameters of the block. While editing the visualization block parameters, you will see the dialog box similar to the one described in the "Visualization block" section. You can also double-click a visualization block to edit its parameters.
Copy Block
Keyboard shortcut: Ctrl+Shift+C
Toolbar button: ![]()
This command becomes available if you select a visualization block on the tab and allows you to copy the selected block. If you select this command, the selected block is automatically copied. Its parameters are identical to the original ones, except for the title. After you copy the block, you can edit the parameters of the copy the way you need it. This feature makes it easier to create several blocks of the same type.
Using the program > Interface > Visualization block
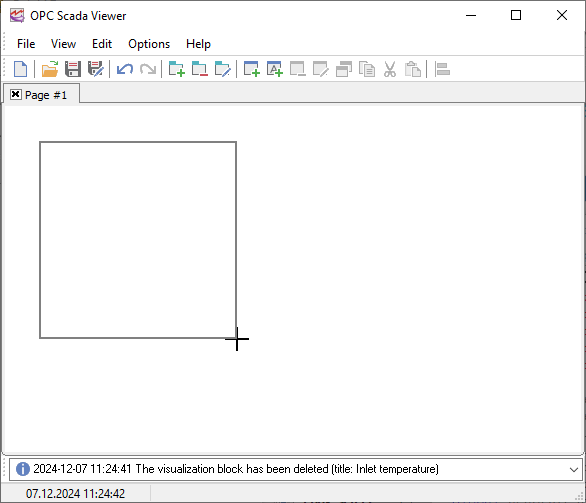
After you select the New Block command, the mouse pointer will look like "+" (a cross) that you can use to mark the borders of the new block. To achieve it, you should hold down the left mouse button and drag the rectangle to make it the necessary size. You can move the block over the tab using either the mouse or the arrow keys on the keyboard. You can use the keyboard to move the block as accurately as possible.
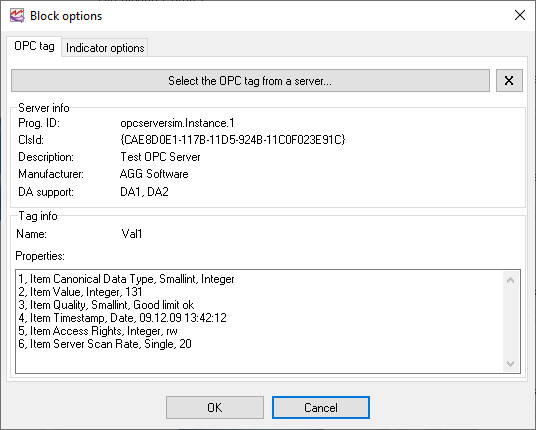
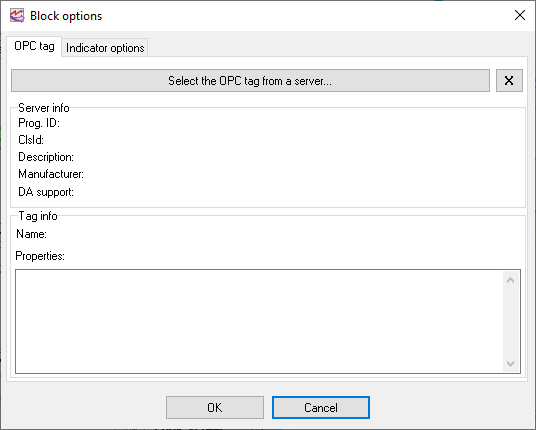
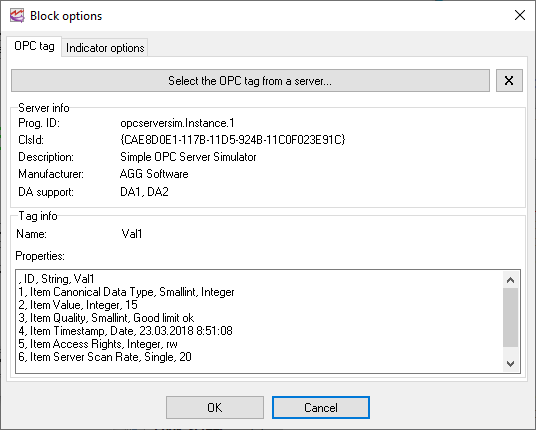
After you finish marking the borders of the visualization block, you will see the Visualization Block Parameters dialog box (fig. 4). First, you should select the OPC tag the indicator will be displayed for. Depending on the tag data type, the list of available indicator types will be formed.
To select a tag, you should:
1.Switch to the "OPC tag" tab (fig. 4) and click the "Select a tag from the server" button.
2.Select the OPC server type from a drop-down menu.
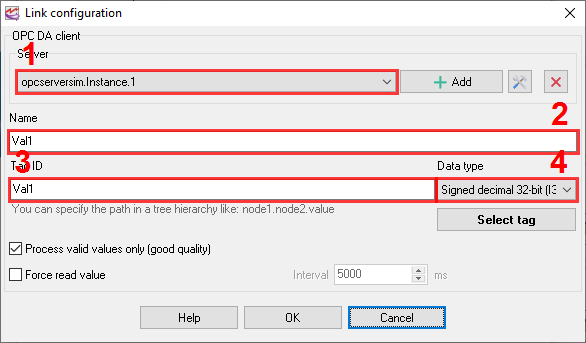
3.You'll get the OPC link configuration dialog box (fig. 5).
1.Server - The list containing all the configured connections for the corresponding OPC type (DA or UA). Once configured, it is possible to utilize the identical connection in other visual blocks.
2.Name - display name of the OPC tag.
3.Tag ID - you have to specify the tag ID (Item ID), including the full path to it if there is any.
Add, Edit, Delete - these buttons allow you to configure or edit a connection with your OPC server.
Process valid values only - If this option is enabled, the program will ignore all values with OPC quality status other than "good" and process valid values only.
Force read - if this option is enabled, the program will force read an OPC tag value from the OPC server. Otherwise, the program will wait for notifications about a value update from the OPC server. This read mode can be useful with some remote OPC servers.
Data type - you can select the data type of your OPC tag and allow the program to detect it automatically.
Select tag - you can choose the OPC tag in the browser by browsing the server's address space. Please keep in mind that some servers may have multiple OPC tags. The retrieval of all tags may require a considerable amount of time.
Server connection parameters
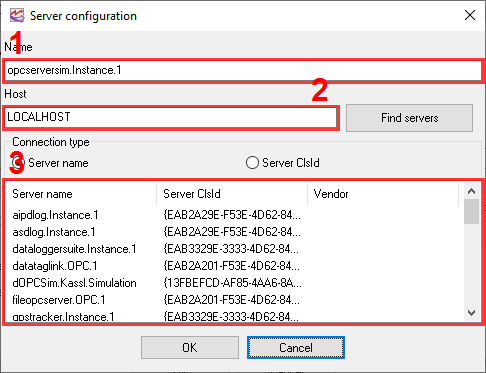
If you configure new or edit existing configuration with your OPC server, the following dialog box will appear (fig. 6).
Name - the display name of the configured connection.
Host - you can specify the name or the IP address of the remote computer. If you need to connect to the server on the local computer, specify LOCALHOST as the computer name. After you enter the computer name, click the "Find servers" button to get the list of available OPC servers. If the program cannot retrieve the list of servers, the following reasons are possible:
•The program was run by a user who has no permissions to connect to remote computer.
•OPC Core Components Redistributable from www.opcfoundation.org are not installed on the local and remote computers.
Servers - the list contains the list of available OPC servers on the specified computer.
•Description - the field shows the brief description of the server.
•DA support - the field shows the supported DA.
•Vendor - the field shows the name of the vendor.
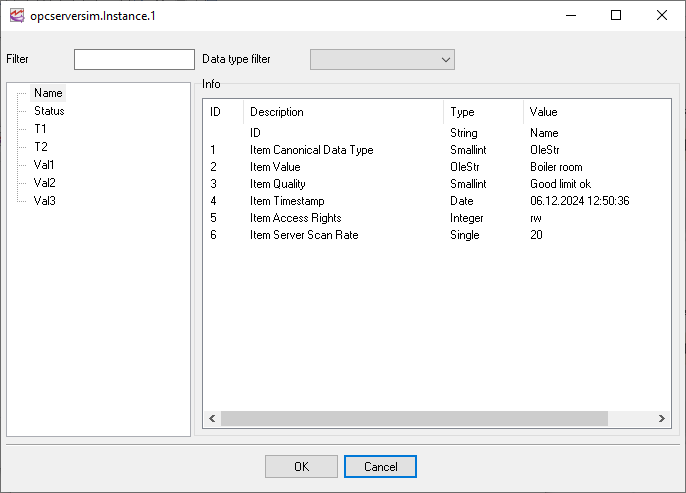
OPC tag browser
Info - the group shows the full information about the selected OPC tag.
The Data type and Filter options enable you to select only tags that meet the specified condition (either by name or by data type) from the ones available on the server. This feature is especially useful when there are countless tags on the server.
Display parameters
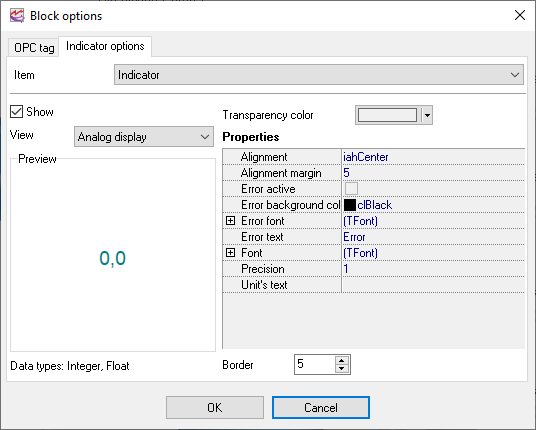
After you select the tag, you should configure the display parameters for this tag. Depending on the tag data type, certain indicators will be available. To configure the display parameters, you should select the "Display Parameters" tab (fig. 8).
Every visualization block has several elements (fig. 9). You can configure every element in the visualization block after you select the corresponding item from the "Item" drop-down list. You can show or hide each of the elements.
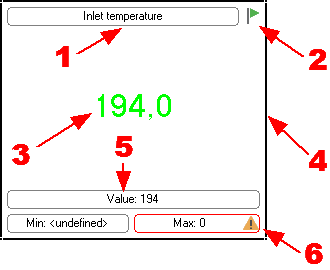
Fig. 9. Visualization block.
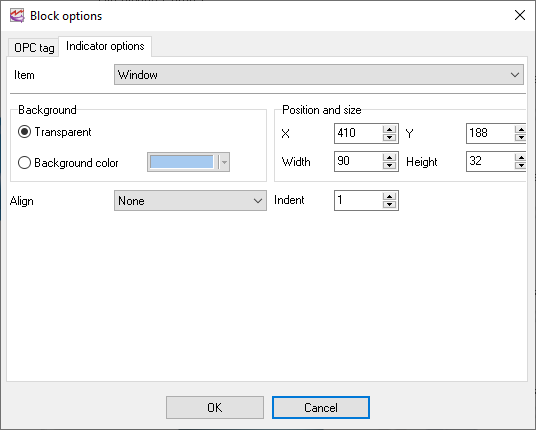
You can use the display parameters to specify the exact position of the visualization block and its size. To accomplish it, you should select "Window" from the "Item" list (fig. 10).
You can also specify the background color for the selected block and its alignment:
1.None - the block will be placed according to the user-defined position. The block size does not change.
2.Left, Right, Top, Bottom - the block will be placed along one of the specified sides. Besides, the block will be resized to fit the tab size. For example, if you select "Left", the block will always be placed along the left size of the tab and the height of the block will correspond to the height of the tab.
3.Client - the block will occupy the entire area of the tab.
Visualization block item description
1.Title - the program allows you to specify any text as the title of a block and to format it.
2.Status indicator - it shows the status of the connection to the OPC server. The green indicator shows that the connection to the server is active, while the red one shows that the connection has been broken.
3.Indicator - the value of the tag can be displayed with the help of various indicators. The program offers more than 20 types of various indicators. Each of them has its own set of display parameters that are displayed as a tree in the fig. 9. You can preview changes in this tree of parameters in the preview window to the right from the tree of parameters. Data types the selected indicator can be used for are shown under the preview window.
4.Frame - the frame allows you to visually limit the block size. When the frame is enabled, you can also resize the block with the help of the mouse.
5.Current OPC tag value - some indicators are graphical ones it is difficult to tell the precise value of the tag from. This element allows you to display the precise value in addition to the value on the indicator.
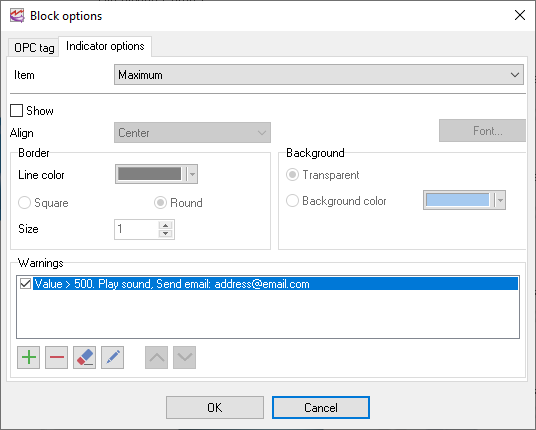
6.Minimum and maximum values for the OPC tag - this parameter allows you to specify one or several conditions (fig. 11) that will serve as a limit for the acceptable values of the tag. If the value exceeds the specified limit, the program will show a warning.
You can do the following for every element in a visualization block (fig. 12):
•Show or hide the element with the help of the "Show" option.
•Specify the type, size and color of the font using the standard dialog box opened with a click on the "Font" button.
•Specify the alignment inside this element using the "Alignment" drop-down list.
•Specify the frame color.
•Specify the background color.
You can specify the list of conditions for the "Value", "Minimum" and "Maximum" elements (fig.8). If they are met, the program will display warnings and play the specified sound. To add a warning, select the corresponding element in the list and click the "Plus" button. After that, you will see the dialog box where you should specify the necessary parameters (fig.9). Other buttons next to it are used for the following operations (left to right):
1.Add a new warning.
2.Delete the selected warning.
3.Delete all warnings.
4.Edit the selected warning.
5.Move the selected warning one position up.
6.Move the selected warning one position down.
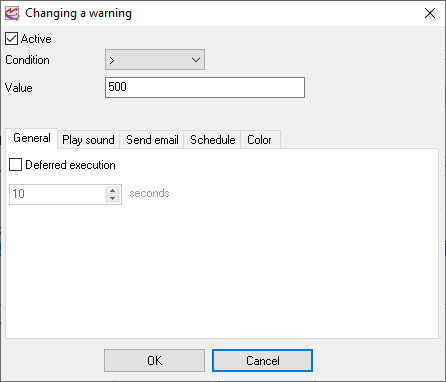
Fig. 12. Warning parameters.
You can configure the following parameters in the Warning Parameters dialog box:
1.The condition that will trigger it. While specifying the conditions, keep in mind that some conditions cannot be used for some data types. For example, string values can be checked only if they are equal.
2.Deferred execution. If this option is enabled, then the program will wait the specified time and if the value returns to the normal state within this interval, the enabled actions will not be executed.
3. Actions:
1.Play sound (fig. 13) - when this action is active, the selected sound will be played when the condition is true. Once - the sound will be played only once when the condition state will be changed from false to true. Continually - the sound will be played until the value returns to the normal state.
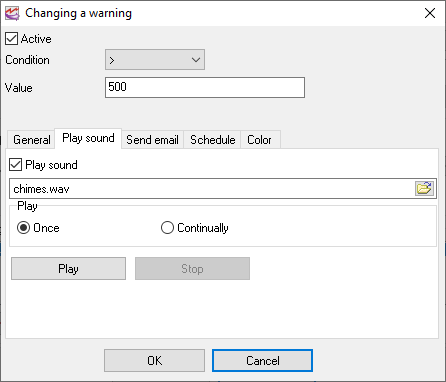
Fig. 13. Sound settings.
2.Send email - an email will be sent to the specified address when the condition state will be changed from false to true. The subject and body of the email can be defined below the address. You may use special placeholders like %VALUE% in the subject or body. When the program sends the email, all these placeholders will be replaced with their values:
%FULL-DATE% - date and time
%DATE% - date
%TIME% - time
%VALUE% - the current value
The connection parameters with an email server you may define in the Program settings.
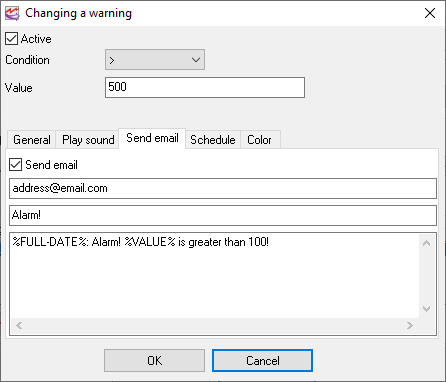
Fig. 14. Email settings.
3.Schedule - this tab allows defining a schedule when this condition will be active. You may select necessary days of the week or/and the time of the day. If the time is not defined, then the condition is active 24 hours per day.
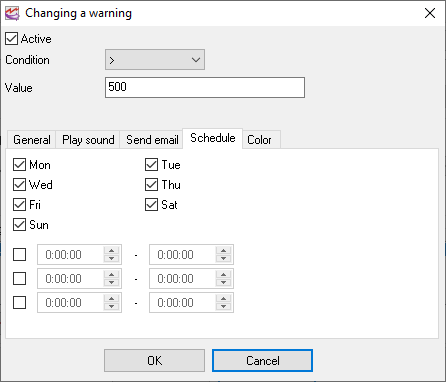
Fig. 15. Schedule.
Scaling
This function allows scaling the value using simple math functions (fig. 16). The scaled value will be visible in the block and will be used later (e.g. in the warnings). Of course, you may use the scale function for the numerical values only.
Examples:
X*2-1
100*COS(X)
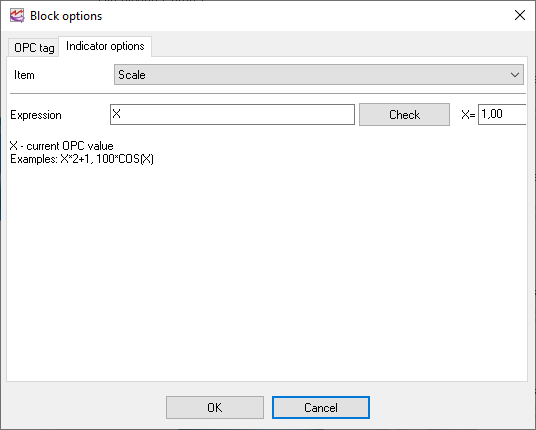
Fig. 16. Scale.
Scripts
The script allows you to extend the standard functionality (fig. 17, 18). For example, they allow transforming the OPC tag value as you want. The built-in scripting engine uses BasicScript. This is a simple implementation of the Basic programming language.
The BasicScript structure is:
dim i, j = 0 // var section
function f1() // procedures and function
end function //
sub p1()
end sub
// main procedure that will be executed.
for i = 0 to 10
p1()
next
Additionally, the scripting engine has two special functions:
GetValue(Name) - this function returns the current value from a block with the "Name" OPC tag.
SetValue(Name, Value) - this function sets a new value in a block with the "Name" OPC tag.
The Name argument should match the name from the "Tag info - Name" fields.
Example:
' Case operator demo
dim val1, val2, name1, name2
name1 = "ThisBlockOpcTagName"
name2 = "AnotherBlockOpcTagName"
val1 = GetValue(name1)
select case val1
case 1: val2 = "new value 1"
case 2..10: val2 = "new value 2"
case else: val2 = "new value 3"
end select
SetValue(name2, val2)
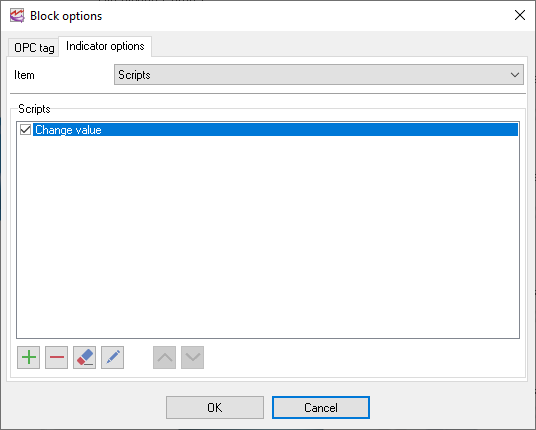
Fig. 17. Scripts.
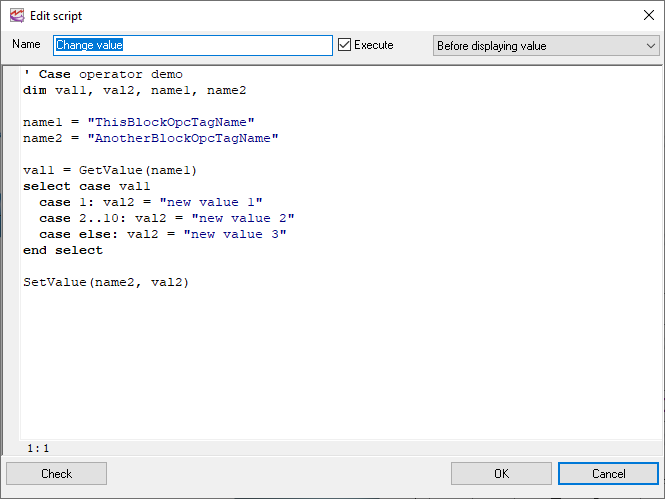
Fig. 18. Script.
Click the "OK" button to save the warning parameters. The warning will appear in the list after that.
To save the visualization block parameters, click the "OK" button in the Visualization Block Parameters dialog box. All changes will be applied after that.
Options menu
Clear log - the command allows you to clear the program log of all messages. The data is removed only from the program window. The log file the program creates during its work is not deleted.
Forbid configuration changes - this option allows you to allow and forbid changes in the configuration. A warning message will be displayed in case of an attempt to change the parameters of tabs and visualization blocks, their size and position.
Forbid changes in block positions and sizes - If this option is enabled, you will not be able to accidentally move or resize a visualization block. It is still possible to edit the parameters of blocks.
Options
This menu item allows you to open the Options dialog box (fig. 19).
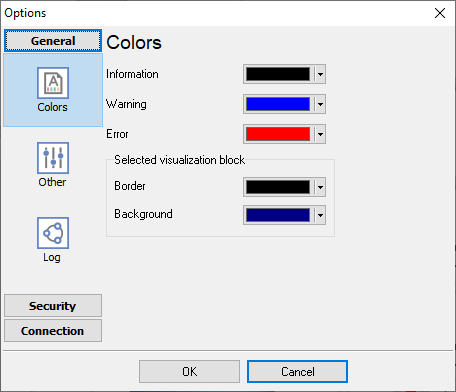
Fig. 19. Color settings
Use the "Colors" tab to specify the colors for various elements of the program and for the notification window.
Other
Use the "Other" tab (fig. 20) to specify whether the program will ask for confirmation when you delete tabs and visualization blocks.
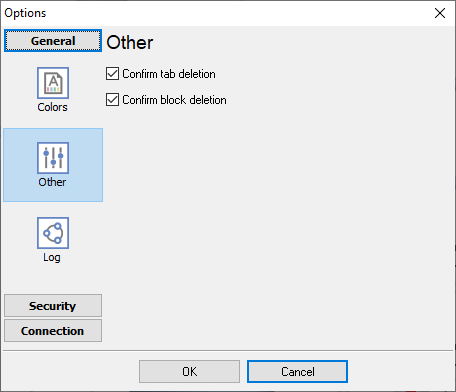
Fig. 20. Other settings
Log
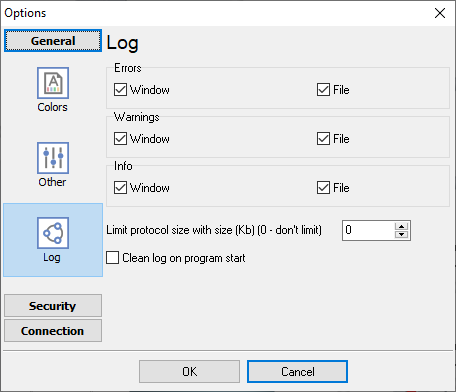
Fig. 21. Log settings
The "Log" tab (fig. 21) allows defining the log level of program messages. You can write the type of each message to a protocol file or/and to the list in the main window. Please specify necessary options for each message type at "Window" and "File" fields.
If you don't want to allow to grow a protocol file size to an unlimited size, then you can enable the "Clean log on program start" or limit protocol file size in the "Size" field.
Security
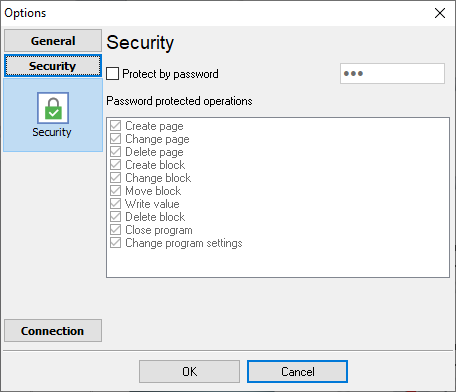
Fig. 22. Security settings
On the "Security" tab (fig. 22) you can protect some actions with the program with a password. To achieve that, activate the "Protect by password" option, define a password and select protectable actions.
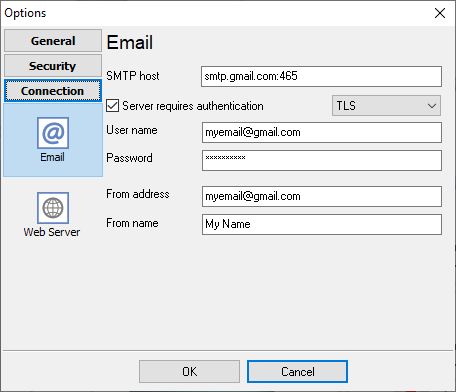
Fig. 23. SMTP server settings
On the "Email" tab (fig. 23) you may define the connection settings with your mail server. These settings will be used when the program sends the warning emails. The figure above illustrates the parameters for Gmail.
Using the program
To start working with the program, you should make several simple steps.
1. Adding a tab
Select the "Edit" - "New Tab" menu item. Use the new dialog box to specify the tab parameters (fig. 24) and click the "OK" button. A new tab will be added in the program (fig. 25).
2. Adding a visualization block
Select the "Edit" - "New Block" menu item. Move the mouse pointer over the unoccupied area of the new tab (fig. 26) until you see the mouse pointer turns into the cross. Hold down the left mouse button and specify the borders of the visualization block
3. Selecting an OPC tag
When you release the left mouse button, the Visualization Block Parameters dialog box will be opened (fig. 27). Switch to the "OPC tag" tab in this dialog box. Click the "Select a tag from the server" button on this tab.
1.Use another dialog box (fig. 28) to enter the computer name where the OPC server is running. If the server is located on the same computer where the program is running, leave the field with the computer name empty.
2.Click the "Update" button.
3.Select the server from the list.
4.Click the "Connect to the server" button.
5.Select the tag from the list.
6.Click the "OK" button.
After you click "OK", the information about the tag must appear on the "OPC tag" tab in the Visualization Block Parameters dialog box (fig. 29).
4. Activating a connection
Switch to the "Connection" tab and make sure that the "Active" option is enabled.
5. Configuring the display parameters
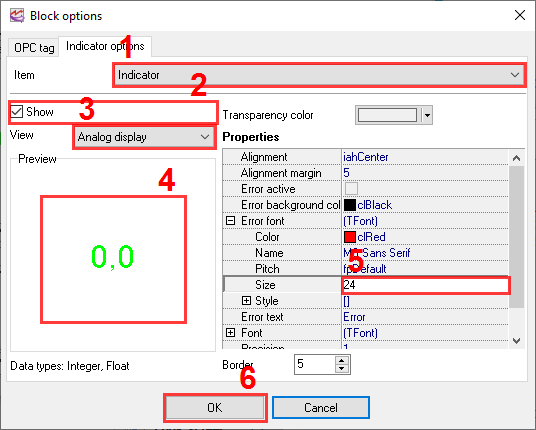
Switch to the "Display Parameters" tab. You can configure many parameters on this tab. At least, you should select and configure the indicator for the selected tag (fig. 30). To do it:
1.Select "Indicator" from the "Item" list.
2.Enable the "Show" option.
3.Select the indicator type.
4.The appearance of the indicator will be shown in the preview window.
5.Use the parameter tree to configure the indicator parameters, if necessary.
6.Click the "OK" button to save all changes.
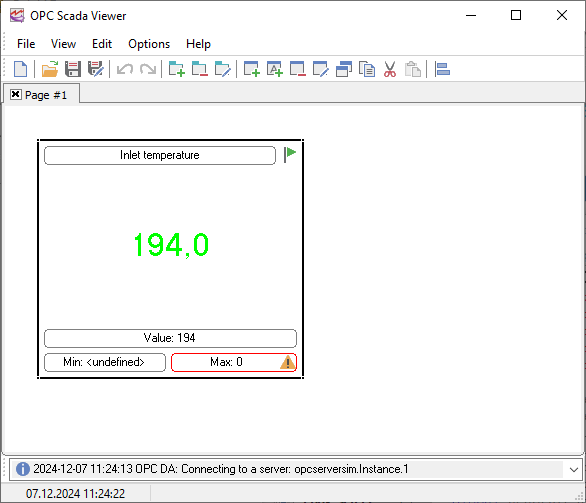
After you save changes, the corresponding block will appear on the tab (fig. 31).
This way you can add an unlimited number of blocks and get the operating monitoring window, as shown in the "Introduction" section.
Script syntax
The program has the built-in scripting engine. The syntax of this script language is compatible with BasicScript or VBScript, but the list of supported functions is fully different. The program folder contains the "ScriptSamples" folder with some examples.
Please note, the program will stop all operation for the current block while executing a script. Avoid scripts with a long execution time.
The script list of function includes some special functions:
function GetValue(Name: string): Variant
This function returns an OPC tag value from any visualization block.
Name - the name of the OPC tag. If the name begins with the "@" character, the program searches for a block by a caption. For example:
' this command searches the block with the "Var" OPC tag on the "opcserver.OPC.1" server
v = GetValue("opcserver.OPC.1.var")
' this command searches the block with the "Var" OPC tag on any OPC server (simple syntax)
v = GetValue("var")
' this command searches by the "MyBlock" caption
v = GetValue("@MyBlock")
function SetValue(Name: string; Value: variant)
This function set an OPC tag value in any visualization block.
Name - the same as GetValue.
Value - the new value.
function GetParam(BlockName, ParamName: string): Variant
This function returns a visualization block parameter.
BlockName - the same as GetValue
ParamName - parameter ID.
ind.visible - true/false, the block visibility state
ind.win.transparent - true/false, transparency
ind.win.backcolor.use - true/false, use a background color
ind.win.backcolor - integer number, a background color value
ind.win.left - integer number, the X position of the top-left corner
ind.win.top - integer number, the Y position of the top-left corner
ind.win.width - integer number, the horizontal size of the block
ind.win.height - integer number, the vertical size of the block
ind.win.align - integer number, 0 - none, 1 - left, 2 - right, 3 - top, 4 - bottom, 5 - window.
ind.win.indent - integer number, the margin
ind.border.show - true/false, show the block border
ind.border.color - integer number, a border color value
ind.border.width - integer number, a border width
ind.border.transparent - true/false, transparency
ind.border.backcolor.use - see above
ind.border.backcolor - see above
ind.caption.show - true/false, show the block caption
ind.caption.text - text, caption text
ind.caption.align - integer number, 0 - left, 1 - center, 2 - right.
ind.caption.border.color - integer number, the border color for the caption
ind.caption.border.square - true/false, a square border of the caption
ind.caption.border.round - true/false, a round border of the caption
ind.caption.border.size - integer number, the border size
ind.caption.transparent - see above
ind.caption.backcolor.use - see above
ind.caption.backcolor - integer number, the background color
ind.state.show
ind.ind.show
ind.ind.transparent
ind.ind.border.size
ind.value.show
ind.value.align
ind.value.border.color
ind.value.border.square
ind.value.border.round
ind.value.border.size
ind.value.border.transparent
ind.value.border.backcolor.use
ind.value.border.backcolor
ind.minvalue.show
ind.minvalue.align
ind.minvalue.border.color
ind.minvalue.border.square
ind.minvalue.border.round
ind.minvalue.border.size
ind.minvalue.border.transparent
ind.minvalue.border.backcolor.use
ind.minvalue.border.backcolor
ind.maxvalue.show
ind.maxvalue.align
ind.maxvalue.border.color
ind.maxvalue.border.square
ind.maxvalue.border.round
ind.maxvalue.border.size
ind.maxvalue.border.transparent
ind.maxvalue.border.backcolor.use
ind.maxvalue.border.backcolor
function SetParam(BlockName, ParamName: string; Value: variant)
This function set an OPC tag value in any visualization block.
BlockName - the same as GetParam.
ParamName - the same as GetParam.
Value - the new value.
The program saves the changed value if user wants to save the configuration.
procedure ShowPage(Page: string)
The program opens the specified page. If "Page" is a number the program shows the page with the specified index (zero based). Otherwise, the program searches a page with the specified caption.
function ExecuteFile(FileName, Parameters, WorkingDir: string; Options: integer): integer
Executes the specified file.
FileName - pass the fully qualified file name
Parameters - string that specifies the parameters to be passed to the application
WorkingDir - specifies the default (working) directory for the action. If this value is empty, the current working directory is used.
Options
0 - Hides the window and activates another window.
3 - Maximizes the specified window.
6 - Minimizes the specified window and activates the next top-level window in the z-order.
9 - Activates and displays the window. If the window is minimized or maximized, Windows restores it to its original size and position. An application should specify this flag when restoring a minimized window.
5 - Activates the window and displays it in its current size and position.
10 - Sets the show state based on the SW_ flag specified in the STARTUPINFO structure passed to the CreateProcess function by the program that started the application. An application should call ShowWindow with this flag to set the initial show state of its main window.
7 - Displays the window as a minimized window. The active window remains active.
8 - Displays the window in its current state. The active window remains active.
4 - Displays a window in its most recent size and position. The active window remains active.
1 - Activates and displays a window. If the window is minimized or maximized, Windows restores it to its original size and position. An application should specify this flag when displaying the window for the first time.
function AppendFile(FileName, Data: string): boolean
Appends text to the specified file. If the file does not exist, then it will be created.
function WriteFile(FileName, Data: string): boolean
Writes text to the specified file. If the file already exists, then it will be overwritten.
function ReadFile(FileName: string): string
Reads all text from the specified file.
GetValue/SetValue demo
' Case operator demo
dim val1, val2, name1, name2
name1 = "ThisBlockOpcTagName"
name2 = "AnotherBlockOpcTagName"
val1 = GetValue(name1)
select case val1
case 1: val2 = "new value 1"
case 2..10: val2 = "new value 2"
case else: val2 = "new value 3"
end select
SetValue(name2, val2)
File execution demo
dim val1, name1
dim working_dir = ""
dim parameters = ""
name1 = "ThisBlockOpcTagName"
val1 = GetValue(name1)
if val1 > 100 then
ExecuteFile("C:\alert.bat", parameters, working_dir, 0)
end if
Log file demo
dim val1, name1, s
name1 = "ThisBlockOpcTagName"
val1 = GetValue(name1)
if val1 > 100 then
s = "Value is too high"
AppendFile("C:\Logs\log.txt", s) ' create or append to a text file
end if
More demos
You may find more demos and examples in the "ScriptSamples" folder in the program folder.
Handling events
You may handle the mouse click event for the specified block using a script.
In this case, you should include the "onclick" function to your script. The program calls this function directly for every click and supplies the following arguments:
caption - text, the caption of the block.
shift - text, "shift" - the shift button is down, "ctrl" - the control button state, "alt" - the alt button state.
button - text, "left" - the left mouse button, "right" - the right mouse button, "double" - a double click.
area - text,
"state" - the state indicator.
"caption" - the block caption.
"minwarn" or "maxwarn" - the warning indicator for the minimum/maximum value.
"minval" or "maxval" - the minimum/maximum limit value.
"ind" - the indicator's area.
"value" - the current value.
If the function return the true the program does not execute default handlers for the event.
Example:
function onclick(caption, shift, button, area) as boolean
ShowMessage(caption & " " & button)
ShowPage("2")
return false
end function
Re-using scripts
If you want to re-use one script in multiple block, you may do the following:
1. Add the full script in a block.
2. Add the following command on the top line in another block:
imports "@BlockName::ScriptName"
This commands searches a block by the "BlockName" caption and reuses the "ScriptName" script.
Also, you may load scripts from a file.
imports "ScriptName.vb"
This commands loads a script from the "ScriptName.vb" file in the program folder.
imports "c:\ScriptName.vb"
This commands loads a script from the specified path.
Note: the program does not monitor script files. Therefore, you need to restart the program if you made changes in your external script file.
BasicScript functions
There is a rich set of standard functions which can be used in a script.
function IntToStr(i: Integer): String
function FloatToStr(e: Extended): String
function DateToStr(e: Extended): String
function TimeToStr(e: Extended): String
function DateTimeToStr(e: Extended): String
function VarToStr(v: Variant): String
function StrToInt(s: String): Integer
function StrToFloat(s: String): Extended
function StrToDate(s: String): Extended
function StrToTime(s: String): Extended
function StrToDateTime(s: String): Extended
function Format(Fmt: String; Args: array): String
function FormatFloat(Fmt: String; Value: Extended): String
function FormatDateTime(Fmt: String; DateTime: TDateTime): String
function FormatMaskText(EditMask: string; Value: string): string
function EncodeDate(Year, Month, Day: Word): TDateTime
procedure DecodeDate(Date: TDateTime; var Year, Month, Day: Word)
function EncodeTime(Hour, Min, Sec, MSec: Word): TDateTime
procedure DecodeTime(Time: TDateTime; var Hour, Min, Sec, MSec: Word)
function Date: TDateTime
function Time: TDateTime
function Now: TDateTime
function DayOfWeek(aDate: DateTime): Integer
function IsLeapYear(Year: Word): Boolean
function DaysInMonth(nYear, nMonth: Integer): Integer
function Length(s: String): Integer
function Copy(s: String; from, count: Integer): String
function Pos(substr, s: String): Integer
procedure Delete(var s: String; from, count: Integer): String
procedure Insert(s: String; var s2: String; pos: Integer): String
function Uppercase(s: String): String
function Lowercase(s: String): String
function Trim(s: String): String
function NameCase(s: String): String
function CompareText(s, s1: String): Integer
function Chr(i: Integer): Char
function Ord(ch: Char): Integer
procedure SetLength(var S: String; L: Integer)
function Round(e: Extended): Integer
function Trunc(e: Extended): Integer
function Int(e: Extended): Integer
function Frac(X: Extended): Extended
function Sqrt(e: Extended): Extended
function Abs(e: Extended): Extended
function Sin(e: Extended): Extended
function Cos(e: Extended): Extended
function ArcTan(X: Extended): Extended
function Tan(X: Extended): Extended
function Exp(X: Extended): Extended
function Ln(X: Extended): Extended
function Pi: Extended
procedure Inc(var i: Integer; incr: Integer = 1)
procedure Dec(var i: Integer; decr: Integer = 1)
procedure RaiseException(Param: String)
procedure ShowMessage(Msg: Variant)
procedure Randomize
function Random: Extended
function ValidInt(cInt: String): Boolean
function ValidFloat(cFlt: String): Boolean
function ValidDate(cDate: String): Boolean
function CreateOleObject(ClassName: String): Variant
function VarArrayCreate(Bounds: Array; Typ: Integer): Variant
Web server
The program has a built-in simple web (http) server. This server allows remotely monitor indicator's state. If the web server is enabled (fig. 32), the program periodically creates snapshots of all pages. Users may open a URL address in a browser and monitor snapshots.
Additionally, you may define a login and password for users and restrict access.
In the "White list" you may specify a list of IP addresses what can access the server. If the list is empty, all users may try to connect to the server.
The URL example on the local computer:
http://127.0.0.1:8081
The URL example on a computer in your local network:
http://192.168.1.1:8081
The URL example in Internet:
http://11.22.33.44:8081
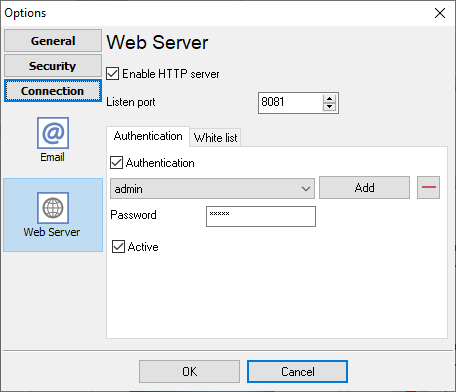
Fig. 32. Web server settings
Please note, you may need to add rules to your firewall for this web server.
If you want to access this web server from Internet, you may need to configure your router and redirect the selected port number to the computer with the program.
