
Advanced TCP/IP Data Logger - Online help | Advanced TCP/IP Data Logger
About Advanced TCP/IP Data Logger
Advanced TCP/IP Data Logger inputs TCP/IP data directly into file, Excel, Access, database or any Windows application. Advanced TCP/IP Data Logger provides real-time data collection from any device or instrument. Send and receive serial data across the Internet or network connection.
Advanced TCP/IP Data Logger captures serial data, custom tailors it to your needs, then extract bits of data from data packets and transfers the data to any Windows or DOS application - either by sending keystrokes to the application's window, by passing the data through DDE (Dynamic Data Exchange) conversations, ODBC, OLE.
Key features of Advanced TCP/IP Data Logger are:
•capability to log multiple ports at the same time.
•can work as a server or a client.
•variable data receive.
•received data output without any changes to a file.
•variable format file forming setting (on time, data, size, etc.).
•advanced data parsers that allows you to parse, filter and format your source data;
•data export to any ODBC-compatible database (MS SQL, Oracle, MS Access, MS Excel, dBase and others).
•Advanced TCP/IP Data Logger can run as DDE or OPC server and can export all received data.
•Advanced TCP/IP Data Logger can use direct connection (use OLE) to Microsoft Excel and write data directly to rows or columns.
•program messages logging.
•auto program restart in showed time.
•simple, menu-driven step by step set-up - programming is not required to configure the software to collect data.
•many plugin modules that extending program features.
•It supports various operating systems. The logger runs on all versions starting from Windows 2000, including 32 and 64-bit systems.
Advanced TCP/IP Data Logger also transmits requests or commands over a network connection to control or query your instruments directly from Advanced TCP/IP Data Logger over ASCII or MODBUS protocol over TCP/IP.
Unlike most other serial logging applications, Advanced TCP/IP Data Logger runs as a service so that it starts as soon as the operating system starts and doesn't require a user to log in and run it. It will continue to run even as a user logon and logoff the workstation.
It is extremely easy to use! The configuration process is fully menu-driven and has complete, context-sensitive, online help. You can easily customize all input to your exact specifications. Once you see how easy it is to use Advanced TCP/IP Data Logger, you will never again take data readings by hand!
Typical usage
A typical application for Advanced TCP/IP Data Logger is to log data from one or more Terminal Servers to disk. A Terminal Server is a device that allows RS232 or RS485 serial devices to be connected directly to an Ethernet network. Terminal Servers typically have an Ethernet connector and one or more RS232 or RS485 ports and they use the TCP/IP network protocol by sending the data that is transmitted through the RS232 or RS485 serial port to a TCP/IP port. Each Terminal Server would have its own IP address and all serial data would be sent through a specific TCP/IP port number.
Another typical application is remote access to an RS232 or RS485 controlled technology. I/O controller is an ideal device if you need remote digital I/O signalizations (Ethernet input, Ethernet output), remote relay control, server accessible remote inputs together with a RS-232 or RS-485 bus for a bar code reader, display, etc..
Applications examples
•Remote control of technology over an RS-232 and RS-485 bus;
•Remote control of displays and signaling;
•Remote reading of PIR sensors, door contacts and security systems;
•Remote relay control;
•Industrial I/O;
•Card readers, RFID readers;
•Sales machines;
•Security alarms;
•Attendance systems;
•UPS control and logging;
•Bar code readers.
Therefore you can connect all your remote serial devices to one industrial server and collect all data to one place!
Company home page: https://www.aggsoft.com/
Software home page: https://www.aggsoft.com/tcpip-data-logger.htm
Glossary
ASCII - An acronym for American Standard Code for Information Interchange. ASCII files are plain, unformatted text files that are understood by virtually any computer. Windows Notepad and virtually any word processor can read and create ASCII files. ASCII files usually have the ".TXT" extension (e.g., README.TXT).
Binary File - A file that contains data or program instructions written in ASCII and extended ASCII characters.
Bit - A binary digit in the binary numbering system. Its value can be 0 or 1. In an 8-bit character scheme, it takes 8 bits to make a byte (character) of data.
Bytes - A collection of eight bits that represent a character, letter or punctuation mark.
Cable - Transmission medium of copper wire or optical fiber wrapped in a protective cover.
Client/Server - A networking system in which one or more file servers (Server) provide services; such as network management, application, and centralized data storage for workstations (Clients).
DNS (Domain Name System) - A DNS server lets you locate computers on a network or the Internet (TCP/IP network) by the domain name. The DNS server maintains a database of domain names (hostnames) and their corresponding IP addresses. The IP address "8.8.8.8", corresponds to the DNS name www.google.com.
Internet - A global network of networks used to exchange information using the TCP/IP protocol. It allows for electronic mail and the accessing ad retrieval of information from remote sources.
IP, Internet Protocol - The Internet Protocol, usually referred to as the TCP/IP protocol stack, allows computers residing on different networks to connect across gateways on wide-area networks. Each node on an IP network is assigned an IP address, typically expressed as 'xx.xx.xx.xx'.
IP address (Internet Protocol address) - The address of a computer attached to a TCP/IP network. Every client and server station must have a unique IP address. Client workstations have either a permanent address or one that is dynamically assigned to them each dial-up session. IP addresses are written as four sets of numbers separated by periods; for example, 198.63.211.24.
LAN (Local Area Network) - A network, connecting computers in a relatively small area such as a building.
NIC, Network Interface Card - A card containing the circuitry necessary to connect a computer to a particular network media. Typically, the NIC plugs into the computer's accessory bus, (PCI, USB, etc.) and provides a network connection such as 10baseFL (fiber Ethernet), thin-net, AUI, etc.
PC - abbreviation for a Personal Computer.
Ports - is a connection point for a cable.
Protocol - is a formal description of a set of rules and conventions that govern how devices on a network exchange information.
TCP/IP, Transport Control Protocol / Internet Protocol - TCP and IP are communications protocols, that is, structured languages in which data is communicated between one process and another, and between one network and another. TCP/IP is implemented in a multi-level layered structure.
TCP/IP is the 'glue' that ties together the many heterogeneous networks that make up the Internet.
System requirements
Windows 2000 Professional - Windows 10 (2019), including x64 and x86 OS, Workstation, and Server OS.
It is necessary to have at least one working network interface (card) in your PC.
Installation process
If any beta-version was installed on your computer, remove it.
Quit of the working Advanced TCP/IP Data Logger on installation time.
Run an installation file.
By default, the installation wizard installs Advanced TCP/IP Data Logger in the "C:\Programs Files\Advanced TCP/IP Data Logger" or "C:\Programs Files (x86)\Advanced TCP/IP Data Logger" directory of your system disk, but you can change this path.
In the standard distributive of Advanced TCP/IP Data Logger are no additional modules files, which you can download from our site.
Getting started
After you have successfully installed Advanced TCP/IP Data Logger, use the following simple steps to configure and run it.
Open the Advanced TCP/IP Data Logger program from the Start Menu.
At program run, you get into the main program window (fig. 1), main elements of which are the main menu, the data window, the program messages list, and the status bar.
-The data window shows incoming data before or after processing. You can configure the data view mode in the settings
-The drop-down box at the bottom shows all logged program info, warning, and error messages.
-The status bar shows the current state of the selected data source, errors on the data interface, and how many bytes were sent or received.
-The toolbar above the data window provides fast access to the configuration.
-The main menu above the toolbar allows you to edit the program settings ("Options - Program settings..."), manage configurations, open the current logfile from the "File" menu (fig. 2).

Fig. 1. Main program window

Fig. 2. "File" menu item
By default (after installation), the program has not any data sources configured. If the list of data sources on the toolbar is empty, then the program will ask you to add a new configuration. Otherwise, the program will fill in the list of data sources and try to start logging of data sources configured. Yes, of course, all your settings are being saved while exiting from the program and loaded during the program start.
Set-Up is as Easy as 1-2-3
Step 1. Configure one or more data sources.
Click the "Add configuration" button on the toolbar with a big green plus and choose communication parameters for your device. The "IP settings" tab of the "Configuration options" dialog lets you configure your settings.
Step 2. Configure log file.
Select the "Log file" header in the configuration dialog window and enable logging for a necessary data direction.
Step 3. Define how you want the serial data to be parsed and translated.
The "Plugin" button on the toolbar in the main window or "Modules" tab in the dialog window lets you specify how to parse, filter and format your data to the fit the exact format required by your application. It also lets you pre-define automatic output strings to be sent to an external device.
Now, the program process and exports data from one or multiple data sources.
Introduction
The program can work with any network interface cards (NIC). Before configuring our software, the following conditions should be executed:
•If your computer has more than one network interface card (NIC) then Advanced TCP/IP Data Logger will display a list of all the IP addresses for each NIC installed in your system so that you can select the IP Address that you want to use. In order for Advanced TCP/IP Data Logger to act as a server, the computer that it is running on must have at least one network interface card with an IP address assigned to it.
•If Advanced TCP/IP Data Logger will work as a server and your computer receives the IP address dynamically from a DHCP server, then you should ask your network administrator to assign a static IP address to your computer.
How to configure port parameters, you can read in the next "IP settings" chapter.
Advanced TCP/IP Data Logger can save data to a log file(s) without any changes (i.e., create raw binary log files) or write to log files depending on the parser module selected. In the first case, you can view the log file with any hex editor and use this data for further analysis and remaking. In the second case, you can view data with any text editor. You can find more information about log files in the "Log rotation" chapter.
You can watch the data in the data window (fig. 1). The data view is fully customizable. You can watch data in decimal, hexadecimal, or your format. How to customize data view you can read in the "Data view" chapter and how to customize program view you can read in the "Window view" chapter.
The data can be exported or transferred to one or more targets. The simplest way is to configure the log file rotation. However, it is small a part of all features of Advanced TCP/IP Data Logger. Advanced TCP/IP Data Logger has many additional modules (so-called plugins) that are appreciably extending possibilities of the logging software. You can download and install any module supported. Most modules are free of charge for our customers. How to install and configure modules you can read in the "Modules" chapter.
The program and their plugins generate many messages and write them to the list in the main window (fig. 1) and a protocol file that you can use for administration of the software. You can also configure types of system messages. More information about it you can read in the "Protocol and errors handling" chapter.
Data flow diagram
This diagram may help you to understand the flow of data within our software and a place of each module. The following chapters describe all plugin types.

Fig. 3. Data flow diagram
History:
- The flow of binary data (RAW, unformatted data).
- The parsed data (formatted data). The data flow is separated into data packets and variables. Each data packet can be interpreted as a row, and each variable can be interpreted as a column.
Wires with other colors mark other relations with the unstructured data flow.
Work complete
The program saves all settings to the Windows registry when it stops working. All opened data sources will be automatically closed (unlocked, unallocated, or fried).
Useful advices
1. Look through hint helps on all window elements - it may help you to get a picture of this element's function.
2. You can change all program settings without restarting the program. To transfer settings to another computer, you can do the following:
1.Create a configuration backup from the "File" menu and restore it using the same menu.
2.Alternatively, export the registry node with all program settings. Start regedit.exe and export the following registry node:
on Windows x64
HKEY_LOCAL_MACHINE\SOFTWARE\Wow6432Node\AGG Software\Advanced TCP/IP Data Logger
on Windows x32
HKEY_LOCAL_MACHINE\SOFTWARE\AGG Software\Advanced TCP/IP Data Logger
3. On another computer import settings to the Windows registry.
Many main window elements have "hot" keys for quick access to its functions.
•Ctrl+S - analogs to click on "Start/Pause" button on the toolbar.
•Ctrl+C - analogs to click on "Clear" button on the toolbar.
•Ctrl+P - opens the window with the configuration settings.
•Ctrl+L - opens the window with the log file settings.
•Ctrl+W - allows you to configure the data view mode.
•Ctrl+R - shows the window with the program settings.
•Ctrl+E - shows the Windows 2000+ service settings.
•Ctrl+M - here you can configure data query plugins, data parser, and other plugins.
4. You can look at the summary statistic that contains summary about sent and received data, created files, etc. (View - Statistics)
5. You can save program settings to an INI file. It may help to install and use several copies of the program. You can make your choice from the "Options" menu.
6. The program window can display only the last 10 messages. The full program log file (if activated) you can open using the "File - View program protocol file" menu item.
TCP/IP settings
UDP vs. TCP
The most commonly used network protocols today are TCP (Transport Control Protocol) and UDP (User Datagram Protocol). TCP is a proven and reliable protocol, and probably the most widely implemented protocol in use on IP networks today. However, TCP has a lot of overhead and payload issues, and can sometimes be ‘too-reliable’ or robust for many applications. In fact, when used as transport, for many serial-based applications TCP can hinder reliable communications. In contrast, UDP is a much simpler protocol and is being used more frequently today - particularly in areas where bandwidth or throughput is constrained. An example is the predominant use of UDP for transport of wireless data applications.
UDP is first a connectionless protocol. Like TCP, UDP runs on top of IP networks. But unlike TCP, UDP does little to help with transport delivery or error recovery. Instead, it offers a direct way to send and receive packets, letting the software application manage things like error recovery and data retransmission. Once primarily used for broadcasting small messages, UDP is now used for everything from browsers to Instant Messaging, Video, and Voice over IP applications.
While a powerful tool, the downside to using UDP is that there is not ‘connection’ report to know that you have end-to-end connectivity. This often makes detecting whether or not a packet is ‘making it’ from one place to another quite a hassle.
Client vs Server
Advanced TCP/IP Data Logger can be configured to log data from as many ports that you like simultaneously on a single computer. The program allows you to create multiple configurations for this task. Each configuration may contain different settings for each TCP/IP port. Each configuration has a set of TCP/IP parameters that are described below.
Each port configuration (i.e. TCP/IP connection) in Advanced TCP/IP Data Logger can act as:
| 1. | Client. You will need to specify the remote host IP address and the port number for the TCP/IP server that you want to connect to. The IP address that you specify in Advanced TCP/IP Data Logger when configuring it as a client may also be either a URL or the name of a computer located on your network. For example, if you want to connect to a computer named "Plant1", you can simply enter "Plant1" for the IP address instead of the actual IP address. If you are configuring Advanced TCP/IP Data Logger as a client and your network is set up to assign IP addresses dynamically to each workstation, then you may need to use the name of the computer that you want to connect to instead of an actual IP address to guarantee a connection. |
| 2. | Server. In this mode you should specify the IP address of the local computer will be used and you only need to specify the port number that you would like to use. If your computer has more than one network interface card (NIC) then Advanced TCP/IP Data Logger will display a list of all the IP addresses for each NIC installed in your system so that you can select the IP Address that you want to use. In order for Advanced TCP/IP Data Logger to act as a server, the computer that it is running on must have at least one network interface card with an IP address assigned to it. In Microsoft Windows, the TCP/IP protocol can be configured to automatically obtain an IP address from a host computer. It means that your computer may not have an IP address until it is connected to a network server or a host computer. You may need to contact your network administrator to assign an IP address to your computer if you wish to configure a TCP/IP server connection. This is done in the network settings for the TCP/IP protocol in your control panel. |
After you enter the parameters that you would like to use, you must click the "OK" button to establish a connection between Advanced TCP/IP Data Logger and the TCP/IP port. If the current port configuration is set up as a client, it will immediately try to establish a connection to the specified remote server. If the server is not available, Advanced TCP/IP Data Logger will continually try to establish the connection until it is successful. If the port configuration is set up as a server, it will listen on the specified port until a client establishes a connection to it.
If one or more ports are configured already, then Advanced TCP/IP Data Logger is opening these ports and starting logging. If the port is opened successful, then the status bar in the main window displays a status of this port (fig. 1). However, before you should configure port parameters that are described below.
You can create the new configuration by clicking the "Plus" button in the main window (fig. 1) or through the "Options" menu. After you clicked the "Plus" button, the dialog window will be opened (fig. 5). The dialog window contains few sections with parameters. The "IP settings" section is described in this chapter.
To log data from more than one TCP/IP connection, you would create and configure multiple port configurations. You can manage the configuration created with a drop-down menu near the "Plus" button (fig. 4).

Fig. 4. Access to the port configuration
The "IP settings" tab contains indispensable settings of any TCP/IP port: IP address and port.

Fig. 5. TCP/IP parameters
Port
In addition to the IP address, you should specify how to connect to a remote machine. Our software can be thought of as a trunk line with thousands of individual lines (the ports) which are used to connect machines. Some ports are considered well-known ports. For example, the port typically used for network mail systems (SMTP) is port 25, the telnet port is port 23, the network news server port (NNTP) is typically port 119, and so on. To see a list of well-known ports, inspect the SERVICES file in the Windows directory (for Windows NT it is in the WINNT\SYSTEM32\DRIVERS\ETC directory). The SERVICES file is a text file used by Advanced TCP/IP Data Logger to perform port lookups (which return the service name for the specified port) and port name lookups (which return the port number for the specified service name). You can open this file in any text editor to see a list of port numbers, and their corresponding service names. While these well-known ports are not set in stone, they are traditional and their use should be reserved for the service which they represent. When writing network applications, you should select a port number that is not likely to be duplicated by other applications on your network. In most cases, you can choose a port number other than any of the well-known port numbers.
The IP address and port number are used in combination to create a socket. A socket is first created and then is used to establish a connection between two computers. How the socket is used depends on whether the application is a client or a server. If an application is a server, it creates the socket, opens it, and then listens on that socket for computers trying to establish a connection. At this point, the server is in a polling loop listening and waiting for a possible connection. A client application, on the other hand, creates a socket using the IP address of a particular server and the port number that the server is known to be listening on. The client then uses the socket to attempt to connect to the server. When the server hears the connection attempt, it wakes up and decides whether or not to accept the connection. Usually, this is done by examining the IP address of the client and comparing it to a list of known IP addresses (some servers don’t discriminate and accept all connections). If the connection is accepted, the client and server begin communicating, and data is transmitted.
Connection options
If the remote server (in the client mode) or local network interface (in the server mode) is not available and the "Try to connect after unsuccessful attempt" options is True, then Advanced TCP/IP Data Logger will continually try to establish the connection until it is successful. The program will try to establish the connection every N seconds that you can specify in the "Next try after XXX seconds" field.
Server options - Allowed IP addresses
This option is active in the server mode and allows you to enter one or more IP addresses that have access to the server. The server refuses connections from any other IP address. This option is very useful if you transfer your data over an Internet connection or your server computer is connected to a big corporate network. You can specify multiple addresses - one per row. If you do not specify any address here, then Advanced TCP/IP Data Logger will accept connections from all IP addresses.
You can also use a mask in IP addresses like: 192.255.255.255
All parts of the IP address with 255 will be ignored (not tested).
You can also use special characters "+" and "-" before an IP address. IP addresses with these prefixes should be first in the list.
"+" - allow all connections from this address.
"-" - block all connections from this address.
Example:
+192.168.1.255
+127.255.255.255
-1.1.1.1
Firewall settings
After you install Microsoft Windows XP Service Pack 2 (SP2), our Advanced TCP/IP Data Logger may not seem to work. Windows Firewall, enabled by default, blocks unsolicited access to your computer via the network and may be blocking the normal operation of the program. To provide increased security to Windows XP users, Windows Firewall blocks unsolicited connections to your computer. When Windows Firewall detects incoming network traffic that it does not recognize, a Security Alert dialog box appears. The security alert dialog box looks like this:

Fig. 6. Firewall alert
The dialog box includes the following buttons:
•Unblock this program.
•Keep Blocking this program.
•Keep blocking this program, but Ask Me Later.
For our program to function properly, you must unblock the program by clicking the Unblock button. Unblocking allows Windows XP SP2 to allow the program to continue to work by adding it as an exception to your Windows Firewall configuration. Exceptions are specific programs and processes that you allow bypassing the firewall. After you add a program as an exception, you no longer receive the security alert. If you choose to continue blocking the program, certain functions will be disabled.
Note: If you are using another firewall software, then please, refer to a firewall manual for corresponding settings.
Limitations
The specific limit of connections is dependent on how much physical memory your server has and how busy the connections are:
The Memory Factor: According to Microsoft, the WinNT and successor kernels allocate sockets out of the non-paged memory pool. (That is, the memory that cannot be swapped to the page file by the virtual memory subsystem.) The size of this pool is necessarily fixed, and is dependent on the amount of physical memory in the system. On Intel x86 machines, the non-paged memory pool stops growing at 1/8 the size of physical memory, with a hard maximum of 128 megabytes for Windows NT 4.0, and 256 megabytes for Windows 2000. Thus, for NT 4, the size of the non-paged pool stops increasing once the machine has 1 GB of physical memory. On Win2K, you hit the wall at 2 GB.
The "Busy-ness" Factor: The amount of data associated with each socket varies depending on how that socket's used, but the minimum size is around 2 KB. Overlapped I/O buffers also eat into the non-paged pool, in blocks of 4 KB. (4 KB is the x86's memory management unit's page size.) Thus, a simplistic application that's regularly sending and receiving on a socket will tie up at least 10 KB of non-pageable memory.
The Win32 event mechanism (e.g., WaitForMultipleObjects()) can only wait on 64 event objects at a time. Winsock 2 provides the WSAEventSelect() function which lets you use Win32's event mechanism to wait for events on sockets. Because it uses Win32's event mechanism, you can only wait for events on 64 sockets at a time. If you want to wait on more than 64 Winsock event objects at a time, you need to use multiple threads, each waiting on no more than 64 of the sockets.
If you have more than 64 connection at a time, then we recommend creating multiple configurations in our software (the "Green Plus" button). Each configuration will use different port number and will run in a different thread. This change will allow decreasing the influence of Windows limitations.
Additional parameters
The "Additional" tab contains additional settings of a TCP/IP or UDP connection (fig. 7).
Simple terminal emulation - the program realizes the simple implementation of some terminal protocols. If this emulation is enabled, then the program will process some special commands and character sequences.
Optimize for small data packets - if the logger sends or receives data packets with size less than 1500 bytes, it is recommended to enable this option.
Following options are effective only in the "TCP/IP server" mode:
Limit of simultaneous connections - you can define the number of clients that can connect to the server at the same time. It allows optimizing a server load with a large number of TCP clients.
Disconnect inactive clients after (s) - if a client is connected, but didn't send or receive any data within the specified time, then the connection with this client will be closed. If you will specify "-1," then the clients will not be disconnected.

Fig. 7. Additional parameters
Following options are effective only in the TCP/IP server or client modes:
TCP keep-alive mode
A TCP keep-alive packet is a short packet which is sent periodically by the OS to keep the connection alive. The connection stays alive because those packets and their replies generate small traffic on the connection when the application is idle.
Keep-alives can be used to verify that the computer at the remote end of a connection is still available.
It is simply an ACK with the sequence number set to one less than the current sequence number for the connection. A host receiving one of these ACKs responds with an ACK for the current sequence number.
TCP keep-alive can be sent once every KeepAliveTime (defaults to 7,200,000 milliseconds or two hours) if no other data or higher-level keep-alive have been carried over the TCP connection. If there is no response to a keep-alive, it is repeated once every KeepAliveInterval seconds. KeepAliveInterval defaults to 1 second. Some (buggy) routers may not handle keep-alive packets properly.
Our software supports three modes of keep-alive (fig. 7):
1. Off - the program doesn't use the keep-alive feature at all. You can disable it if your network is very stable or your routers do not support it.
2. System - the program will use the keep-alive feature, but use system values of KeepAliveTime and KeepAliveInterval. These values are stored in the following registry branch:
[HKEY_LOCAL_MACHINE\System\CurrentControlSet\Services\Tcpip\Parameters]
KeepAliveTime (32-bit number) = milliseconds
KeepAliveInterval (32-bit number) = milliseconds
3. Custom - the program will use keep-alive, but you can specify your values of KeepAliveTime and KeepAliveInterval, that are more applicable for your network and system. Note: in our software, you should define these values in seconds.
Note: Some routers may not allow keep-alive TCP packets. In this case, the "keep-alive" function will not work.
Data view change
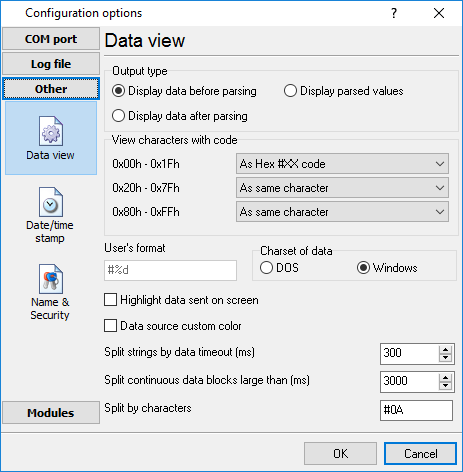
Fig. 8. Data view
Data view settings, that can be configured on the "Data view" tab:
1.View characters with code - the program can interpret and decode bytes as characters. You can select decoding mode for each range of character codes. If the range doesn't have the corresponding character, that's why these data can be displayed only in hexadecimal and decimal code.
2.You can set up the user's format to display a data byte. The directive %d shows to display a decimal code, the directive %x - hex code. You can set any framing characters before/after the user format.
3.Highlight data sent on screen - a string with sent data will be highlighted by the selected color.
4.Character set - allows you to define the character set of incoming data. Windows - Windows ANSI character set, DOS - OEM character set.
5.Data source custom color - if you've created several configurations then you can define a custom color for each data source that allows you to distinguish data flows on the "All data" page in the main window.
6.Split strings by data timeout - this option allows visually splitting data packets in the program window. Data packets that will be received after the specified interval will be shown on a new line. If this value is set to 0, then data packets will not be split.
7.Split continuous data blocks large than - this option allows visually splitting continuous data flow in the program window. The program will show data on a new line if continuous data is longer than the specified number of bytes.
8.Split by characters - this option allows to visually splitting continuous data flow in the program window using the specified symbols. For example (fig. 8), the program will use a character with the 0Ah hexadecimal code that is equal to the "LF" ASCII code.
Date/time configuration
This group of options (fig. 9) allows you to configure how timestamps appear in the log file and on the screen. You can configure the stamp format in the program options.

Fig. 9. Time stamp configuration
Add to display output for data sent - the time stamp will be added for the sent data displayed on the screen. The stamp will be added according to the timeout (if the data flow is uninterrupted) or when a data packet is sent.
Add to display output for data received - the same but for the received data.
Add if data direction has been changed - if the program is sending and receiving data, the time stamp will be also added when the data transfer direction changes (sending/receiving).
Add for data packets - if the data is displayed after it is processed, the stamp will be added to each processed data packet.
Add at begin of file - the stamp will be added at the beginning of every new log file.
Stamp timeout - if the data flow is uninterrupted, the stamp will be added regularly at the interval specified in milliseconds.
File prefix/postfix character(s) - the program will use these characters instead of those specified in the program options while writing data to a file. For example, it allows you to add the new line character or another sequence of characters before or after the stamp. Example: >#0D#0A
Name and security
This group of options (fig. 10) allows you to configure the following parameters:
Friendly name - this name will be added before the port number or the data source in the drop-down list in the main window of the program. It allows you to describe the data source.
Start logging automatically - if this option is enabled the program will start receiving and logging data automatically when it is launched.
The "Security" option group allows you to protect user operations in this particular configuration with a password. You can specify advanced security options applied to the entire program in the program options.
Ask password before start and stop - the password will be required when the user clicks the "Start/Pause" button in the main window of the program.
Ask password before configuration edit - the password will be required when the user tries to open the Configuration options dialog box.

Fig. 10. Name and security
Log rotation
The main function of Advanced TCP/IP Data Logger is logging data to a file (so-called, log file). The "Log rotation" tab has a rich set of options for it. (fig. 11).

Fig. 11. Log-file forming modes
First of all, select log file what you can configure:
•Log file for data received - all data received will be saved using these settings.
•Log file for data sent - these settings will be used to save sent data. If you want to save data to the same file, as data received, then select the "Log file rotation for data sent" option from the list and enable two options: "Create log files on disk" and "Write to log for data received." Of course, you should configure a log rotation for data received before.
Set the "Create log file on disk" option to the checked state. Then you can set path to a folder, where files will be created with the help of a dialog window, which will be showed up after clicking a button with the "Folder" picture. You should select a necessary folder in the dialog window and click the "OK" button.
Log file path - the full path to a local or network folder, where the program will create new log files. The network path should be specified as: \\COMPUTER NAME\Folder\
Note: If the program works with network files, it greatly increases data flow through your network and decreases writing speed. Please, consider creating small log files. If your incoming data flow is fast, you may create log files locally. Later, you may sync a local folder with a remote folder using any 3rd party utility.
A log file name can be stamped with date and time. In this case, a new log file is created periodically. The format of a timestamp depends on the selected period. For instance, if the "File name prefix" field is set to "sample," the "File extension" field to "log," and the "File name format" option is "Daily," then each log file created will have the format "sampleYYYYMMDD.log". On March 21st, 2003, the log file will be "sample20030321.log". Please, note, that the final extension (after the final period), remains at the end of the file name.
Write to log - the option allows you to select when the program writes data to a log file. This feature is disabled in some loggers, and if the parser plugin is not available.
•Before parsing - the program saves all incoming data without any modifications. If an external device sends binary data, the logger will create binary files.
•After parsing - the program saves data after parsing. Generally, it is a parsed data packet.
•After filtering - the program saves data after all filter plugins. The logger saves the content of the "FULL_DATA_PACKET" variable. A filter plugin may transform or fully change the variable. If you do not use any filter plugin, then this mode works as the previous.
•Screen content - the program saves data to a log file as you see it in the main window. Generally, it is text content; therefore, the program creates a text log file.
The log rotation mode is defined by the following key parameters:
•File name prefix - the text string, which will be added at file name beginning. The prefix may contain special placeholders like {NAME}. If you create log files before parsing the NAME can be any date formatting values below. For example: "data{YYYY}_{MM}_{DD}" returns a prefix like "data2019_01_01". If you create log files after parsing or filtering, you may use any parser variable. Then the file name may depend on some value in your incoming data.
•File name extension - the text string, which will be a file extension (characters after the dot).
Limit size - the "Limit size" field specifies the maximum size in kilobytes of any log file. If you specify the zero file size, then the file size is not limited.
You may select from the following modes:
1.Clear file - if the log file size will exceed the limit specified, then the log file content will be deleted, and file filling will start from the beginning.
2.Rename old - if the log file size will exceed the limit specified, then the existing log file will be renamed.
3.Shift (no threshold) - the older data over the limit specified will be removed from the log file.
4.Shift (with threshold) - in this mode the program will wait when the file size will exceed the limit specified + the threshold value. After this, the older data over the limit specified will be removed from the log file.
If the program continuously works for a long time, it is possible that the log file will have a large size and this file will be inconvenient for looking and analyzing. Therefore, there is the possibility to create files in dependence with the time on a computer. You can select one variant predefined or set up a new one:
•Daily - the file will be created with a name containing a prefix, and date in format DDMMYYYY, where DD is two-digit day sign, MM is two-digit month sign, and YYYY is four digits of the current year. The filename extension will be added at the end of the file.
•Monthly - the file will be created with a name containing a prefix, and date in MMYYYY format. The filename extension will be added at the end of the file.
•Each data packet in different file - in this mode, the program splits data flow to a different file. In this mode you should configure the parser or the program will split a data by timeout about 300 milliseconds.
•Don't create new file - in this mode, the program will write all data to one file. It is recommended for a small data flow. Otherwise, your log file will be too big, and a performance of the program will fall down.
•User's format - a file will be created with a name containing a prefix and date in showed by you format (for example, DDMMYYYY). The filename extension will be added at the end of the file. The file may not contain format signs, then file name will be constant. You should not use characters, that the OS doesn't allow in a file name, such as "/,\.*,?" and some others.
•Weekly - create a new file every week. The file name will contain a week number.
•After data timeout - the program will create a new file if the program didn't receive any data at the specified interval.
•Hourly - the file will be created with a name containing a prefix, and date in format YYYYMMDDHH, where HH is two-digit hour sign, DD is two-digit day sign, MM is two-digit month sign and YYYY is four digits of the current year. The filename extension will be added at the end of the file.
•Constantly named file - the current log file will have a constant name. When creating a new file, the existing log file will be saved using the new file name that will contain a date and time stamp.
If you need to create a new log file under more complex conditions, then you can try the additional "Scheduler & Hotkeys" plugin. You should download and install it separately.
Date and time formatting codes:
D - a day number (1-31).
DD - a day number with a leading zero (01-31).
DDD - a day of the week in the text form (Mon-Sat), according to the regional settings on this computer.
DDDD - a day of the week in the full text form (Monday-Saturday), according to the regional settings on this computer.
M - a month number (1-12).
MM - a month with a leading zero (01-12).
MMM - a month name in the text form (Jan-Dec), according to the regional settings on this computer.
MMMM - the full month name (January- December).
YY - last two digits of the year (00-99).
YYYY - the full year number (0000-9999).
H - the hour number (0-23).
HH - the hour number with a leading zero (00-23).
N - minutes (0-59)
NN - minutes with a leading zero (00-59).
S - seconds (0-59).
SS - seconds with a leading zero (00-59).
W - ISO week number (Monday is the start of the week).
WW - week number (the start of the week is defined in System - Regional settings).
To insert arbitrary text or a symbol into a date or time format, and to prevent it from being accidentally replaced with some value, you need to use quotes:
YYYY"/"MM"/"DD - 2023/01/01
YYYY"/"MM"/"DD"T"HH:NN:SS - 2023/01/01THH:NN:SS
Addinal parameters
CLIENTID - the unique client or data source ID (in some data loggers).
CLIENTNAME - the unique client or data source name (in some data loggers).
Example: You want to create a log file every hour. It is desired that file name starts from "sample_log" and the file extension "txt".
Answer: set file prefix = sample_log_, file extension= txt (without dot!). In file name format show HHDDMMYYYY. Now the file will be created every hour. Naturally, you can set any formatting characters combination, described higher.
If you want to access to a log file while the program work, then you should configure access mode settings for the log file in the next chapter.
Add date/time stamp to file name - this option is available for modes #4 and #7 and allows adding date and time to the file name.
Add data source ID to file name - if this option is activated, then the program will append the data source name at the beginning of the file name, for example, COM1-sample20030321.log.
Write data/time stamp to file before writing data - if this option is activated, then the program will write a date/time stamp to a file before each data portion.
Overwrite existing files - this option is available for modes #4 and #7 and allows you to delete an existing log file before creating a new log file.
Log file access
During work can be such situations, when it is necessary to get access to a file with current data (current log file) from other applications (for example, for data processing). However, while you are accessing the current log file Advanced TCP/IP Data Logger can't write data to a log file and all data at this moment will be lost. We recommend using a temporary file for data storage. It is the safest way. (fig. 12).

Fig. 12. File access mode.
You can select one from the following variants:
•Ignore and not write - in this mode, the program stop writing to a log file until it is locked. Therefore, data will be lost.
•Write to a temporary file, then append - a temporary file will be created, to which writing will be done. After access to the current file will be got, temporary file content will be added to the end of the main file. However, mind that if file has a timestamp in the name, there can be a situation when the program copies the content of a temporary file to a new log file, for the next time.
•Display a message and stop work - data will be lost until the dialog window is closed.
You can define your message text, which will be displayed at writing error to a log file. The sound signal can be on for an additional indication. You can also enable writing a message to a protocol file.
Log deletion
The deletion of files (fig. 13) will help you to avoid stuffing your hard disk with needless information. Log files can be deleted either depending on the time of storing or when the maximal number of files is exceeded.
When deleting files by the time of their storage, the files that were modified last time before the specified period are deleted.
When controlling the number of files, the files with the oldest modification dates are deleted first.
You can select both variants of file deletion. In that case, files will be deleted when either of the conditions is true.

Fig. 13. Log deletion
Introduction & setup
To extend program functionality, we implemented plugin modules. The module structure lets you to reduce your program size and purchase costs (you pay only functionality, which you need).
Advanced TCP/IP Data Logger supports a few types of modules (fig. 14 - 16):
•Data query - transmits queries or commands out the data source to control or query your devices.
•Data parser - the data parser allows you to parse, filter, and format data from your data sources. Some of the advanced features of the parser are the ability to work with raw binary or hex data.
•Data filter - data filters allow you to filter your data and modify a value of parser variables.
•Data export (fig. 16) - Advanced TCP/IP Data Logger has many modules and method for passing data to other applications, for example, there are modules for various databases, file formats (CSV, XML), data interfaces (OPC, DDE, MQTT), and many others.
•Events handling (fig. 17) - these plugins are used to handle events generated by the Advanced TCP/IP Data Logger software. Once an event occurs (for example, "Data source is opened" or "Configuration changed"), the plugin creates a text message using the specified template, sends a notification, does some actions, executes a program or a script, etc. The form of the notification or actions depends on the plugin settings.

Fig. 14. Activating plugins

Fig. 15. Activating data export plugins

Fig. 16. Activating events handling plugins
You can parse and export data sent and received. By default, only data received will be parsed.
Installation
You can easily install a new module. Usually, you should start the installation file and click the "Next" button for a few times. The installation wizard will detect a place of your Advanced TCP/IP Data Logger software and place a plugin module and all distributive files to the "Plugins" folder, which is in the program folder (by default X:\\Program Files\Advanced TCP/IP Data Logger\Plugins).
After the program restart, a module will be loaded and initialized. If the module is supported by our software, the module name will appear in the modules list. Most modules require additional settings. If you want to configure the plugin module, click the "Setup" button near it. If you selected the module and the "Setup" button is not active, then the module doesn't have additional settings and can work without additional settings. Please, read a user's manual of the corresponding plugin for additional information.
Configuration steps
1.Select and configure a query module. You may use a module of this type if you need to send some data to your device (for example, initialization strings or request strings).
2.Select and configure a parser module. This step is necessary because filter and export modules can use parsed data only. If you didn't select the parser module, then you can't configure the data filter and data export modules.
3.Activate and configure data export modules. You can select one or more modules simultaneously. The program will use selected modules simultaneously. Please, note, the program can' use the data export module, if you didn't configure the parser module.
4.Activate and configure event modules. You can select one or more modules simultaneously.
OPC server
Advanced TCP/IP Data Logger has an internal OPC server. It means that any OPC compatible client application can get data from Advanced TCP/IP Data Logger without any additional software. To connect to the OPC server, you need the server ID and name (fig. 17). Before using the OPC server on your computer, you should download and install the OPC Core Components Redistributable from www.opcfoundation.org (registration required).

Fig. 17. OPC server parameters
Advanced TCP/IP Data Logger parses all incoming data to one or more variables, and an OPC client gets it (fig. 18). After connecting to the OPC server, you will get a list of all variables.

Fig. 18. OPC server active items
Clients activity is showed on the "Active clients" tab. The top node is client, below is a group of items and connected items. By double-clicking, you can get detailed information about each node.

Fig. 19. OPC server clients
Advanced TCP/IP Data Logger creates new variables at "on-the-fly" mode. The Advanced TCP/IP Data Logger starts without any variables and gets it only after first data had been received. If your client OPC will connect to the OPC server before than data had been processed, then it will get an empty list of variables, and your OPC client should poll the OPC server for updating list of variables. If your OPC client doesn't allow it, then you can predefine all variables (fig. 20). In this case, the OPC server will create these variables with empty values, immediate after starting, and your OPC client will get these names while connecting.

Fig. 20. OPC server pre-declaration
Window view
This tab in program options (fig. 21) allows you to customize the appearance of the main window of the program (fig.1). You can access this tab through the "Options → Program options" menu item in the main window.

Fig. 21. Window view setting
You can set the following parameters:
•Start in minimized state - at start Advanced TCP/IP Data Logger will automatically minimize the program window to the taskbar or to the Systray (fig. 22).
•Minimize to Systray - while the main window of Advanced TCP/IP Data Logger minimizes, the program will automatically put its icon to the system panel near the clock.
•Show data window - if you specify this option, then the program will display all data in the main window. You may disable this option if you log data from many ports on a slow computer. It reduces the computer's CPU usage.
•Output data on screen in minimized state - if you'll enable this option, then the program will display processed data in minimized state. If you are logging many data sources on a slow computer, then you can decrease computer central processor load rate with disabling of this option.
•Font type - the data will be displayed with this font type in the main window. We recommend using mono-spaced fonts in this field, such as Terminal, Courier, or System.
•Screen buffer - when the number of lines in the main window exceeds the specified value, the program deletes old lines from the screen buffer.
•Window view - this option group lets you configure data window view mode (a font color, a font type, a background color).
•Transparency - in modern OS, it lets you set the transparency of the main window. The most left position is the normal window view, and the most right position is maximum transparency.
•Wrap words - if you didn't configure a parser module or your data flow doesn't contain a blocks separator, then your data without this option enabled will be displayed as one long string in the data window.

Fig. 22. Systray - panel near clock
Date/time stamp view
This group of options (fig. 23) allows configuring the format of date/time stamps that will be used in the main program window and log files.

Fig. 23. Configuring data/stamp view
Prefix/Postfix characters for display output - these options allow you to define the beginning and ending characters of a date/time stamp that will be shown in the program window. When outputting data to a log file, the program uses individual characters for each configuration.
View mode - allows you to select the standard or define the custom format of the date/time stamp.
Font - this group allows you to define the color and font of date/time stamp.
Add data direction sign to a stamp - if this option is activated, then the program will append TX or RX to the end of the stamp.
Add data source ID to a stamp - if this option is activated then the program will data append data source ID at the beginning of the stamp, for example, COM1.
Protocol and errors handling
While the program is running, it may generate many messages about errors or events. All these messages are being registered in a protocol file. The protocol file may contain messages from the main program and all working plugins. On this tab, you can define the kind of messages, which you want to put a protocol file (fig. 24). Here you can set the maximum protocol file size and the formatting mode.
Usually, the protocol file is in the "AppData" folder and has the name of the program with the 'log' extension.
On Windows 7 and higher: c:\ProgramData\Advanced TCP/IP Data Logger\
On old OS: c:\Document and Settings\All Users\Advanced TCP/IP Data Logger\
You can also open the protocol file from the “File” menu in the main window.

Fig. 24. Protocol settings
Advanced TCP/IP Data Logger works with three types of messages:
•Information messages - this type of messages informs you about current operations.
•Warnings - warns you about possible failures or errors. Immediately user reaction is not required.
•Errors - the program has detected an error which requires user attention.
There is the possibility to log the following events:
•Program messages - messages about start or stop of the program, etc.
•Data query - messages which are generated in a data query module.
•Data parser - messages from a data parser module.
•Data export - messages issued by a data export module.
•Other - other message types.
You can write each type of messages to a protocol file or/and to the list in the main window. Please, specify necessary options for each message type at "Window" and "File" fields.
If you don't want to allow growing a protocol file size to an unlimited size, then you can enable the "Clean protocol at program start" or limit protocol file size in the "Size" field.
Some exceptional (unhandled) messages may occur while the program is running. In most cases, these messages affect the program, and the safest way is to restart the program. Please, specify the "Restart program at exception" option and the program will be restarted automatically.
If you want to look all program messages, then you can disable the "Don't display messages at unhandled exceptions" checkbox, and the program will open the exception message window with detailed information.
Configuration
Windows 2000+ services let you:
•Control service on local and remote computers, including remote computers with Windows 2000+ system.
•Setup actions on emergency service restore in case of failure, for example, auto service or computer restart (only on computers with Windows 2000 or later).
•Create for services other names and descriptions, to find them easier (only on computers with system Windows 2000 or later).
•Run service before user login (password input).
•Service can be configured on automatic start after operation system load.
Note 1: you must be logged in as an administrator to change the configuration or control the service in any way (start, stop, pause, continue).
Note 2: On Windows Vista and later you should start the program with elevated administrator privileges.
If you want to use the program as a service application, then, please, go to the "Options → Program options → Windows service" tab (fig. 25), then enable the "Use program as a service" checkbox. Later, please, specify the start-up type of the service. There are the following variants:

Fig. 25. Service settings
1.Automatic - the service starts automatically with Windows, before user login.
2.Manual - you can start the service application from the "Services" control panel (fig. 28).
3.Disabled - the service is disabled, and does not start at all.
If you want to change the program settings while the program works in the service mode, you can start a second instance of the program on your desktop, make the necessary changes, and restart the service with the new settings.
Old Windows versions (before Windows Vista) allows you to use the service in the interactive mode. In this case, the program places an icon in the system area (fig. 26).
Fig. 26. Service icon in Systray
If the service should write data a database or use another service on your computer, they should be started before Advanced TCP/IP Data Logger. You can configure a list of these services on the "Program depends on services" tab (fig. 27).

Fig. 27. Service settings #2
Sometimes, you may need to start Advanced TCP/IP Data Logger before starting other services. In this case, you should:
•Switch the start mode of a target service to "Manual."
•Start Advanced TCP/IP Data Logger.
•Select the necessary service on the "Depending services" tab.
•Select the mode when the logger will start the selected service.
•Restart Advanced TCP/IP Data Logger.
After you configured Advanced TCP/IP Data Logger to work in the service mode, you need to restart a computer or start the service manually from the "Services" control panel (fig. 28).
")
Fig. 28. Manual service run (in Windows 2000)
When the service is running, two processes should appear in the Task Manager: aipdlogsrv.exe and aipdlog.exe (fig. 29). The 'aipdlogsrv.exe' application implements an interface between the service manager and the Advanced TCP/IP Data Logger software. Unlike srvany.exe utility, our service stops safely.

Fig. 29. Process list
If you want to configure the program as a service, then you must be logged with administrator rights. The service application can be controlled, stopped, or removed with the help of a command-line. Run aipdlogsrv.exe with the following parameters:
•/? - a short help.
•/I - install service for starting in then manual mode.
•/A - install service for starting in the automatic mode.
•/D - install service in the disabled state.
•/R - remove service from the computer.
Windows Vista+ notes
One of the ways Vista's security was improved was by separating system services and user applications into separate 'sessions'. Keeping the system services isolated helps to secure them better, but also makes any interactive interface unavailable to the user. That's where the Interactive Services Detection service comes in. When a service needs to interact with the user, Interactive Services Detection presents a dialog that will switch the user to the session where the service is running so they can interact with the service. For an excellent, detailed description of this, see next paragraph.
Many sites recommend disabling this service, but doing so will result in you not being able to interact with any services that require your attention. This service is run manually by default, so there is little point to disabling it unless you don't want to be bothered by important information from the software you may be trying to run.
•Display Name: Interactive Services Detection
•Service Name: UI0Detect
•Process Name: UI0Detect.exe
•Description: Enables user notification of user input for interactive services, which enables access to dialogs created by interactive services when they appear. If this service is stopped, notifications of new interactive service dialogs will no longer function, and there may no longer be access to interactive service dialogs. If this service is disabled, both notifications of and access to new interactive service dialogs will no longer function.
•Path to Executable: %windir%\system32\UI0Detect.exe
•Default Start-up:
1.Home Basic: Manual
2.Home Premium: Manual
3.Business: Manual
4.Enterprise: Manual
5.Ultimate: Manual
Restart & Security
Sometimes the program should be restarted. For example, if you've changed the program settings remotely and want to reload program automatically with the new settings. To do that, specify the time for restarting the program on the "Restart & Security" tab in program options "Options - Program options". Just specify the time of day, when the program should be being restarted.

Fig. 30. Program restart settings
On this tab, you can also protect some actions with the program by a password. To do that, activate the "Protect by password" option, define a password and select protectable actions.
Program doesn't run or work
It is necessary to make sure in proper time installation on your computer, so as if you put clock after program installation, protection from use after trial period works.
Also, the program will not work, if you use a software debugger in your environment like WinDbg. In any other case, please, contact us on support page.
Program may not work properly if your firewall blocks program activity. How to configure firewall settings, you can read in the chapter "IP settings".