
Serial Port Sniffer for Windows - Capture & Analyze RS232 COM Data
A serial port sniffer shows you the exact bytes a Windows program and a serial device exchange, in order, with the time between them, while that program keeps running. This page explains how a software sniffer gets at that data, walks through the four steps to capture a session with Advanced Serial Port Monitor, and says plainly what a software sniffer cannot see.
When you need a serial port sniffer
You reach for a sniffer when guessing has stopped working:
- A device does not answer, and you cannot tell whether the program sent the wrong request or the device never replied.
- Data arrives garbled, and you suspect the baud rate, parity or flow control, but the program's settings dialog does not show what it really uses. The causes outside the program are in the garbled serial data checklist.
- A vendor application works and yours does not, and the protocol is undocumented, so you need to see what the working one sends.
- A legacy program drives a scale, printer or controller, and you must know its exact command sequence before you replace it.
In each case the answer is the same: watch both directions of the traffic on the port, with timestamps, without stopping the program that is using it.
Sniffer, monitor or analyzer?
The terms overlap. A serial port sniffer, also called a serial sniffer or COM port sniffer, captures raw bytes on a port in use. A serial port monitor usually adds a terminal, so you can also send data yourself and watch the control lines. A protocol analyzer decodes a known protocol, such as MODBUS RTU, into readable values. Advanced Serial Port Monitor does all three: the sniffer is its Spy mode, the terminal is its Manual mode, and the MODBUS plugin does the decoding.
How a software sniffer sees the data
Windows opens a COM port in exclusive mode. Once one program has the port open, a second program cannot open it, which is why an ordinary terminal cannot watch a port that is in use. A software sniffer works around this at a lower level: it installs a filter driver in the driver stack of the port. Every request the application makes, whether it sets the baud rate, writes a packet or reads a reply, travels down that stack as an I/O request packet. The filter driver sees each packet on the way past, copies it with a timestamp, and passes it on unchanged. The application never notices.
Two consequences matter in practice. First, you do not need to know the communication parameters in advance: the sniffer reads the baud rate, data bits, parity and flow control from the requests the application itself makes, and can show them to you. Second, the sniffer must be attached to the port before the application opens it, because the filter sees requests from the moment of the open call.
Does watching disturb the link? No. The filter copies; it does not take part. It never opens the port on its own, sends nothing to the device, and passes every request through with the parameters the application chose, so a running connection to a PLC, meter or instrument keeps running while you watch. The application keeps exclusive use of the port throughout. If you want to prove this before touching production equipment, attach the sniffer to the same kind of device on the bench first and compare the device's behaviour with and without the sniffer open.
The driver is installed together with Advanced Serial Port Monitor; there is nothing separate to download. It works on real ports and on anything Windows presents as a COM port: USB-to-serial adapters, RS232-to-Ethernet converters, Bluetooth serial links and virtual ports created by other software.
Software sniffer, monitoring cable, or hardware tap?
Three ways to intercept a serial link cover almost every diagnostic job. Choosing the wrong one costs an afternoon.
Software sniffer on the PC. Use it when the PC you are sitting at is one end of the link. It needs no cable, no second port and no change to the wiring, and it is the right tool for protocol problems, parameter mismatches, timeouts and reverse engineering. This is Spy mode.
Dual-port mode with a monitoring cable. Use it when the traffic runs between two external devices, for example a PLC and a panel, and no PC is in the loop. A simple RS232 monitoring cable feeds the TX line of the link into one COM port of the PC and the RX line into another; the program opens both ports side by side and shows each direction separately.
Hardware tap. A tap is a box wired inline that reads the voltage on the TX, RX, RTS and CTS lines and reports to its own software. It is the right tool when the fault is electrical, when signal timing at the line level is in question, or when the Windows PC itself is the suspect and a sniffer running on it could be affected by the same problem. For everything above the electrical layer a software sniffer shows the same bytes for a fraction of the cost.
For testing software with no device at all, pair two virtual COM ports and put the sniffer on one of them; see how to connect two COM ports locally.
Capture a session in four steps
Step 1: Attach to the port before the other program starts
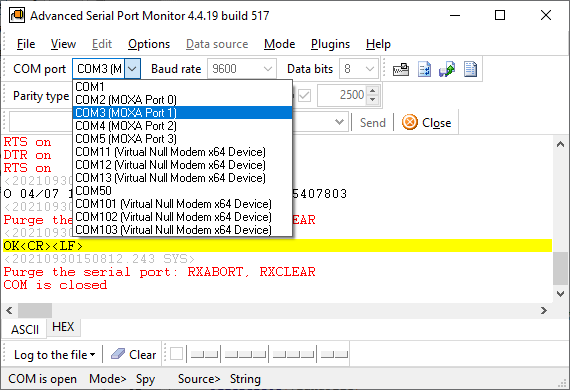
Close the application you want to observe. Start Advanced Serial Port Monitor, choose Mode → Spy, and pick the port from the list at the top left. The list shows every port with its device name, for example "COM10 - USB SERIAL CH340", so you do not need Device Manager to find the number. If you also want to see the parameters the application uses, open Options → Program settings → Data view → System events and tick all events. Click Open. Only now start the application.
Step 2: Read the traffic
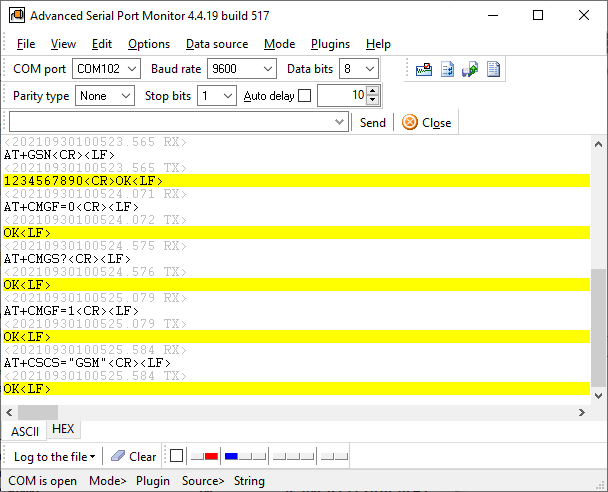
Both directions appear in the window as they happen. Switch between the ASCII and HEX views at any time; sent and received data are shown in different colors, and each packet can carry a date and time stamp with millisecond precision and the time elapsed since the previous packet. System events, including the open request and the parameters, are highlighted in red. For a binary protocol stay in the HEX view; for a text protocol the ASCII view reads faster.

Step 3: Find the fault
Start with the parameters: scroll to the top of the ASCII window and compare the "Baud rate" and "Data bits" lines with what the device expects. A mismatch here explains most garbled data. Next look at the rhythm: a request with no reply points at the device or the wiring, a reply that arrives after the program's timeout points at the program. Check the control lines if the device needs RTS/CTS flow control. If the protocol is MODBUS RTU or ASCII, enable the MODBUS plugin, which ships with the program, to see register values next to the raw frames and to spot a wrong slave address, function code or CRC.
Step 4: Log it
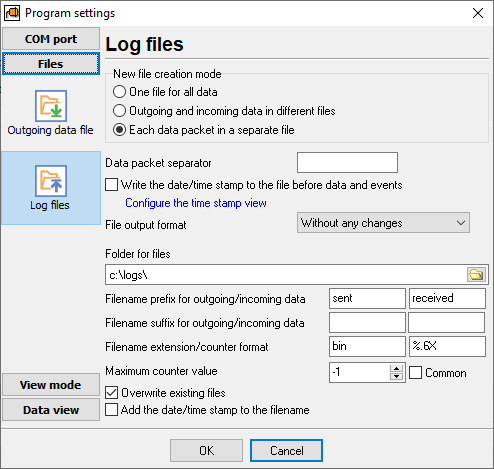
For an intermittent fault, start a log file with the Write to file button before you begin and let the session run. Received and sent data can go to one file or to separate files, and the program can start a new file for each packet or whenever a signature you define appears in the data. Every line keeps its timestamp, so you can find the exact moment a device stopped answering. A saved log can later be played back to a port with the original pauses by the Replay log plugin.
What a software sniffer will not show you
- A port that is already open. If the application opened the port first, the sniffer cannot attach until the application closes it. Close the application, leave the sniffer open, and start the application again.
- Traffic between two external devices. The PC must be one end of the link. Otherwise use dual-port mode with a monitoring cable, as described above.
- Electrical faults. Wrong voltage levels, noise and line timing below the byte level are invisible to any software; that is hardware tap territory.
- Protocols other than MODBUS. The plugin decodes MODBUS RTU and ASCII. Any other protocol is shown as raw bytes, and you do the decoding.
- USB traffic that is not a COM port. A USB device that does not present a serial port, such as a HID or a custom USB class, needs Advanced USB Port Monitor instead.
- Weeks of unattended recording into a database. A sniffer is for looking and saving what you saw. For continuous logging with parsing and export, the right tool is a COM port logger.
- Anything outside Windows. The program runs on Windows only, including inside a Windows virtual machine with the port passed through.
Check that the sniffer is attached
Two minutes settle it. Open the port in Spy mode with system events enabled, then start the application and make it do one thing, for example read a weight or send one command. The first lines in the ASCII window, in red, should be the open request and the parameters, followed by the bytes in both directions. If the window stays empty:
- The application was already running. Close it, keep the sniffer open, start it again.
- The application uses a different port number than you think. Find the COM port an application uses.
- The port is held by a service or a hung process. Switch to Manual mode, click Open, and the program names the process that holds the port; see port busy, access denied.
FAQ
Does the sniffer use a driver?
Yes. A filter driver installs together with the program and attaches to the driver of the port you select. It records every request and every byte in both directions with timestamps, and it lets the program show the baud rate and other parameters the observed application uses.
Is it compatible with Windows 11 and 64-bit systems?
Yes. The driver is signed with a Microsoft-trusted Extended Validation certificate, and the program runs on Windows 11, Windows 10, Windows 8 and Windows 7, and on Windows Server 2012 through 2025, 32-bit and 64-bit.
Do I need administrator rights?
Installing the program and its driver needs an administrator. Day-to-day use, including Spy mode, does not. One exception: to see the name of the process that holds a busy port, start the program with "Run as administrator".
Does it capture full-duplex traffic?
Yes, by default. Because the driver sits between the application and the port, both directions are captured with nothing to configure. Between two external devices, use dual-port mode with a monitoring cable; each direction then arrives on its own port.
Which port types does the sniffer support?
Any port Windows lists as a COM port: built-in RS232 ports and PCIe cards, USB-to-serial cables and USB-UART dongles (FTDI, CH340, Silicon Labs), RS232-to-Ethernet converters, Bluetooth serial links, and virtual COM ports created by software. RS485 and RS422 devices are covered through a converter. No special sniffer cable is needed.
Does it work in a virtual machine or over Remote Desktop?
Yes. The program and its driver run in a Windows guest under VMware, VirtualBox or Parallels when the serial port or USB adapter is passed through to the guest, and the program can be used over Remote Desktop. It does not run under Wine or CrossOver on macOS.
Can monitoring disturb a running industrial link?
No. The sniffer copies traffic inside the driver stack and passes every request on unchanged; it does not open the port, sends nothing, and does not change the baud rate, framing or flow control the application set. The application keeps exclusive use of the port. What can disturb a link is a second program trying to open the same port, which Windows refuses, or a home-made monitoring cable that connects one of the PC's transmit pins to the line. Attach in Spy mode before the application starts, and for two external devices wire the monitoring cable from the diagram, which connects only the receive pins.
Want to compare before you decide? See six serial port monitors compared, or go straight to the product page for the full feature list and the 14-day free trial.
See also
MODBUS Slave Emulator: Advanced Serial Port Monitor Plugin Guide
RS232 Analyzer from Advanced Serial Port Monitor
RS232 Monitor
RS232 Port Sniffer
Serial Port Spy
RS232 Terminal
UART Monitoring Using Our Serial Port Monitor
Related topics: Advanced Serial Port Monitor
hereRS232 monitor RS232 analyzer COM Port Debug RS232 terminal Serial port sniffer Serial port spy UART monitor RS232 pinout and signals Data monitor cables.