Advanced Serial Data LoggerTrust In Confidence! For Windows 2000 - Windows 11 (2022) (incl. Server, x86 and x64). Latest version: 4.7.7 build 417. April 17, 2024. Process data from the lab equipmentDownload a Free Trial Version. It allows you to try all features! Plugins can be downloaded separately here
Problem scenario: I want to connect an RS-2322 port to MS Excel. The port will provide a stream of ASCII numeric characters to Excel. I want Excel to automatically receive and graph the ASCII data, sort of like an oscilloscope. I can control the format of the incoming ASCII data.
Requirements:
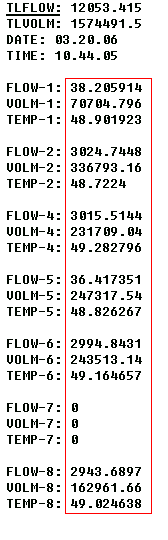
It is assumed that: You've configured communication parameters (baud rate, the number of data bits, flow control, etc.) in the data logger and can receive any data without communication errors. You can work in Microsoft Excel, specifically create charts in an Excel file. Solution: The image above shows that the data flow is very simple, but we should extract data variables from a report with multiple rows. At the same time, the figure doesn't contain non-printable characters and doesn't show the ending characters of a data packet. We need to recognize the ending characters of each data record. Please, enable display output for non-printable characters with a character code below than 0x20h. You need to create a port configuration. Please, click the "Plus" button in the main window if you didn't make it before and set the following options.
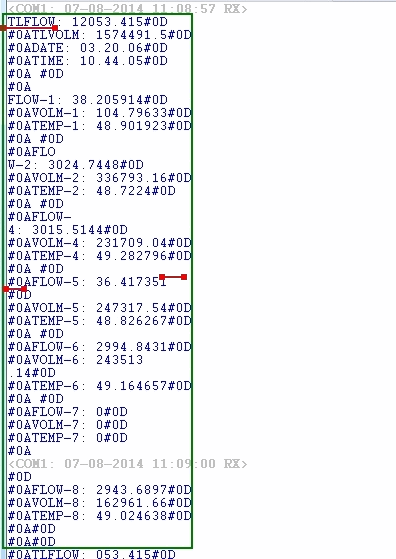
Then click the "OK" button and try to receive the data from a port. You should receive the data as in the figure below.
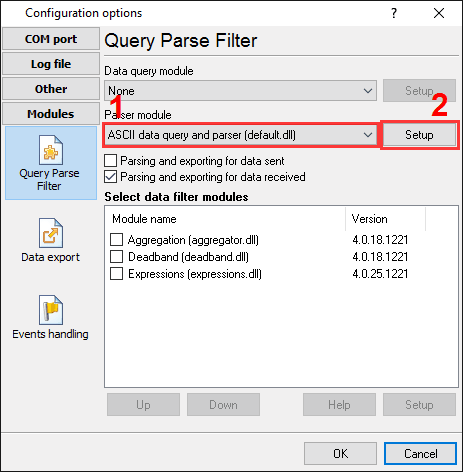
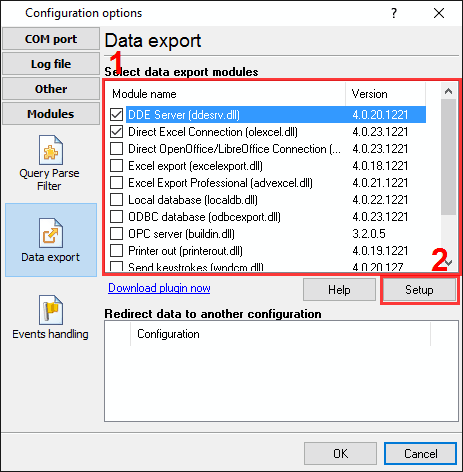
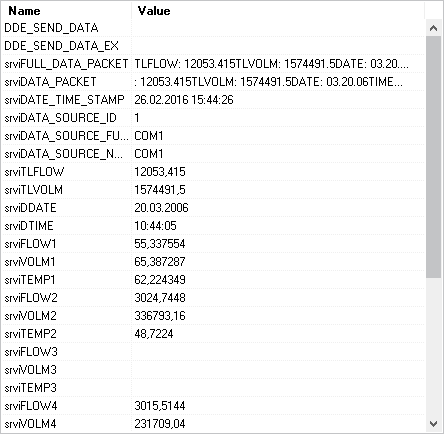
It is a different view of the data received. Notice that all non-printable characters were replaced with their code, i.e., #0D. It is clear from the data screen above that the data block (within the green rectangle) starts with TLFLOW and ends with three pairs of CR+LF characters (#0D#0A#0D#0A#0D#0A) (underlined by red). We are now ready to configure the modules. First, select the "ASCII data query and parser" plugin (fig.4a, pos.1) from a drop-down list. Then, enable a parsing option for data received (fig.4a, pos.2) and select the necessary data export plugins. The DDE server (fig.4b, pos.3) will help us to check that the data packet is parsed and exported. The "Direct Excel Connection" plugin will write data directly to a Microsoft Excel spreadsheet.
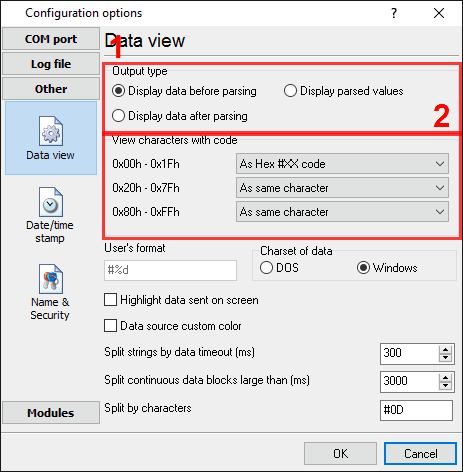
Now, please, open the ASCII parser and query configuration window by clicking the "Setup" button near a drop-down box (fig.4a, pos.1). The dialog window below will appear on the desktop (fig.5).
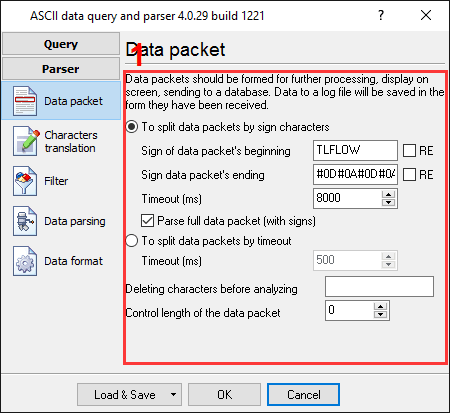
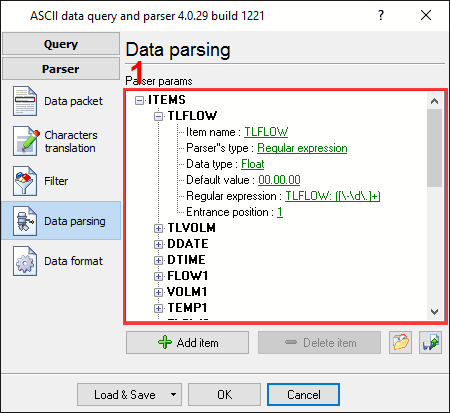
The configuration process should be very simple if you have examined your data flow in the data logger window (fig.3). You should type in the same as in the data logger window in fields 1 and 2. Field #1 marks the beginning of the data block, and field #2 marks the end. In this example, our data block contains both markers. Therefore, all fields are not empty. The values to be typed in here are as underlined in red in fig.3 above. Because the report in this example is very long, then we should increase the "Timeout" value (fig.5 pos.#3) to prevent the loss of data. The option at pos.4 allows you to use the start marker in the parsing process. The next tab is a very important part of the parser configuration. The data parser uses this information for data extraction from the data block. In the example, the data block contains 28 data items (see fig.1), namely: DDATE, DTIME, TLFLOW, TLVOLM, and so on, which should be separated out into different variables. Later, these variables will be used in the data export and will be placed in different columns of our excel file. The file with all variables you can download here and load it on the "Data parsing" page (fig.6 pos.#8).
Any new items may be added by clicking the "Add item" button (fig.6, pos.7). Before adding an item, the program will ask you about an item description. You can type any characters here, which will help you to remember a variable's content. For this example, all 28 variables with their corresponding descriptions have been added. Each parser item has a number of properties:
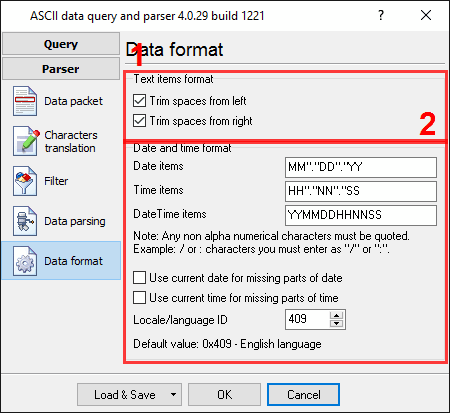
All other items have identical parameters, except a data type and a regular expression. On the next tab, you can specify basic format options as per (fig.7). In this example, two variables have "date" and "time" data types. Therefore the first option allows you to convert the date string to a field with the "date" data type. We specified MM"."DD"."YY and HH"."NN"."SS here, according to the specification above. For a detailed description of formatting characters, please, see the help file. The second option allows you to convert the time string to a field with the "time" data type.
Other options are unnecessary in our case because all our items do not have the "datetime" or "string" data type. Click the "OK" button and close the parser configuration window. Then click the "OK" button in the options window. Now that our parser is ready, it is time for testing it. Connect your device and power it on if necessary. Check to see if you can receive a data block from the specified port. If the parser had been correctly set up, then you should see all parser items and their values (fig.8) in the DDE server window below.
All parser variables are now ready for export to an Excel spreadsheet. You can read about it in the second part. Related articles: |
|