
Real-Time Serial Data Export and Charting in OpenOffice & LibreOffice Calc
Problem scenario:
I want to connect an RS-2322 port to OpenOffice Calc or LibreOffice Calc. The COM port will provide a stream of ASCII numeric characters to OpenOffice Calc. I want OpenOffice Calc to automatically receive and graph the ASCII data, sort of like an oscilloscope. I can control the format of the incoming ASCII data.
Requirements:
- Advanced OPC Data Logger Professional, Enterprise, or a trial version;
- Direct OpenOffice/LibreOffice Connection
It is assumed that:
You've prepared parser items for export.
You can work in OpenOffice Calc or LibreOffice Calc, specifically create charts in Calc.
For this tutorial, all items were prepared in the previous part.
Also, you may read other examples:
- Process data from a barcode scanner
- Parse data with the help of regular expressions
- Parse data from the filling machine
- Log and parse data from an intellectual pressure measuring device
Solution:
All parser items are now ready for export using the "Direct OpenOffice/LibreOffice Connection" plugin. Please, open the configuration window of the "Direct OpenOffice/LibreOffice Connection" plugin (fig.2) by selecting the module in a list (fig. 1, pos. 4) and clicking the "Setup" button on the "Data export" page (fig. 1).
The configuration is very similar to the "Direct Excel Connection" plugin.
Note: Please, interpret the "Excel" word on the screenshots and in the program interface as "OpenOffice Calc."
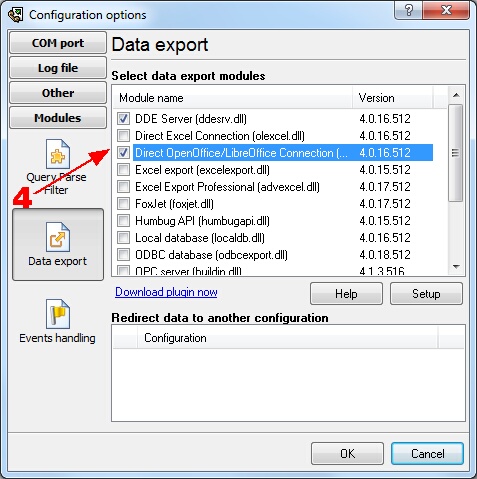
Fig.1. Data export plugin for OpenOffice Calc.
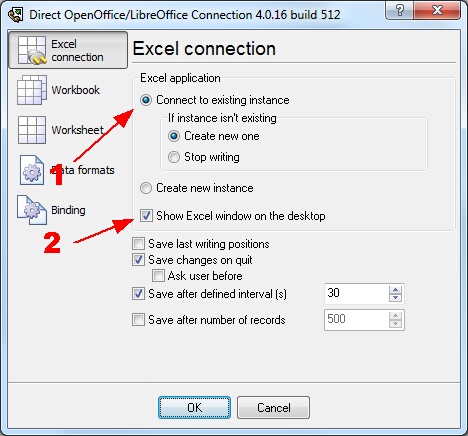
Fig.2. Charting. OpenOffice Calc connection.
You need to select options in field #1 and field #2. These options will allow you to start OpenOffice Calc and display it on your desktop. OpenOffice Calc will be started automatically on program start.
Because we want to draw a chart in a real-time environment, then we should prepare an OpenOffice ODS file before the next step. In this example, we've created a diagram with three plots. Each plot is based on data from columns A, B, or C. We'll place FLOW1, VOLW1, and TEMP1 to columns, and the chart will use these values and automatically redraw every time. We'll use the last 30 values on the diagram only.
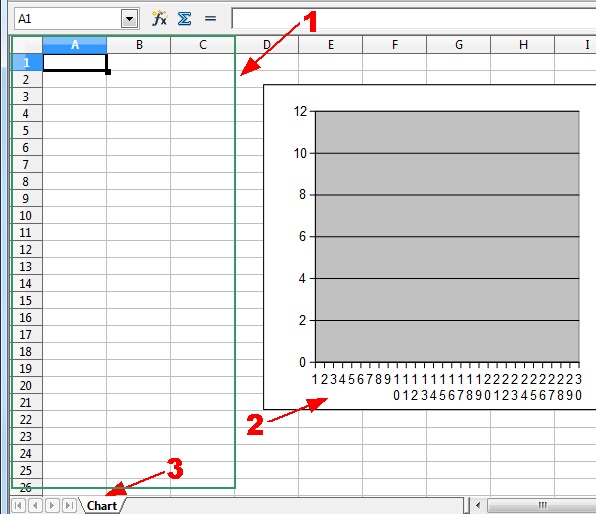
Fig.3. Charting. OpenOffice/LibreOffice file.
The figure above contains the following elements:
- The data source for the diagram;
- Diagram;
- OpenOffice worksheet.
The ODS file, which we've created you can download here and use it in your work.
In the next tab, you should specify your workbook options as per your requirements (real-time charting).
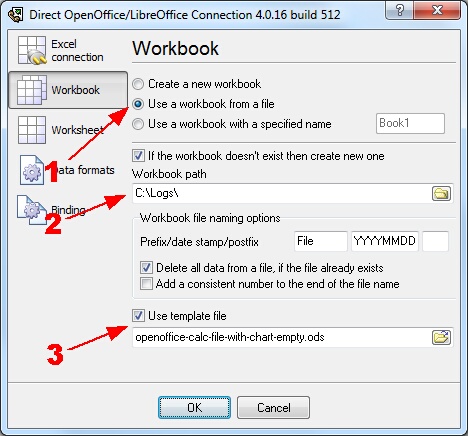
Fig.4. OpenOffice Calc. Workbook options.
You should select the "Use a workbook from a file" option (fig.4 pos.1) that allows you to use an existing file and write data to this file. The path and name of this file, which you created before (fig.3), you should specify in field #2. The option at the pos. 3, allows you to save all the written data when the program exits.
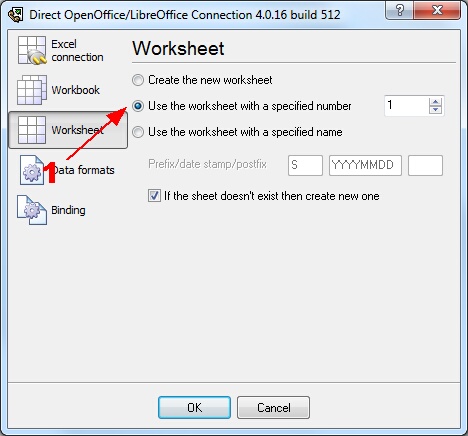
Fig.5. OpenOffice Calc. Worksheet options.
In the next tab, with the help of the option at the pos. 3, you should specify your worksheet number in the workbook. We've created the workbook, where the worksheet is first. Therefore, we've specified this number on the "Worksheet" page.
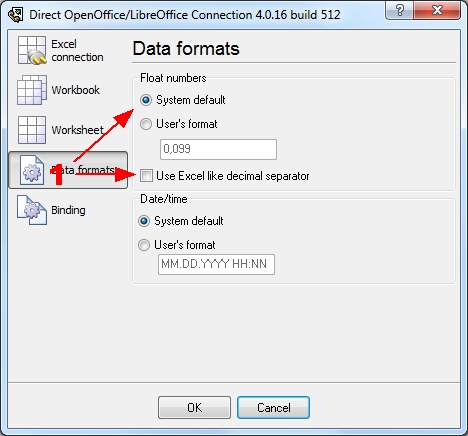
Fig.6. OpenOffice Calc. Data format.
The last "Binding" page (fig.7) is significant. On this page, you should bind a parser variable to the necessary column.
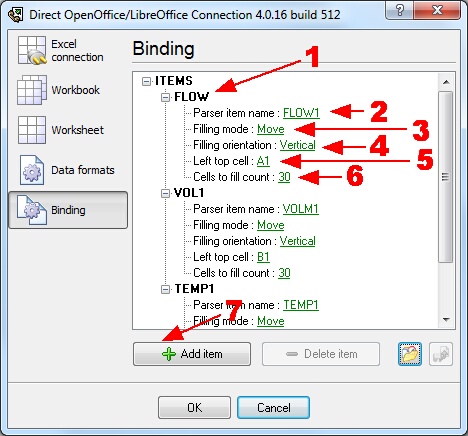
Fig.7. OpenOffice Calc. Binding.
Any new items can be added by clicking the "Add item" button (Fig.7, pos. 7). Before adding an item, the program will ask you about an item description. You can type any characters here, which will help you to remember a variable's content. For this example, three variables with their corresponding descriptions have been added.
Each data export item has several properties:
- Parser item name. It is a parser variable name, which you have created in the parser configuration. You may select a variable name from a drop-down box or type this name manually for variables defined or created in filter plugins;
- Filling mode. Suppose the number of cells available for the filling was exceeded, the plugin will move data upwards (if the plugin fills data by columns), or to the left (if the plugin fills data by rows), and new data will appear in an unoccupied cell. Thus, the plugin uses the FIFO filling method. In this example, we need the last 30 values. Therefore, we've selected the "Move" method;
- Filling orientation. In this example, we need to send data to OpenOffice/LibreOffice Calc by columns. Therefore, we've selected the "Vertically" method;
- Left top cell - here, you should specify the coordinates of the upper-left cell, starting from which data will be sent to OpenOffice/LibreOffice Calc. The format the coordinates are specified in should comply with the standard accepted in OpenOffice/LibreOffice Calc. For example, a record like A1 will mean the coordinates of the top-left cell on the worksheet;
- Cells to fill count - here you can specify the maximum number of cells in a column or in a row that will be filled when data is sent to OpenOffice/LibreOffice Calc.
Click the "OK" button and close the Direct OpenOffice/LibreOffice Connection plugin configuration window and the "OK" button in the options window.
Okay, all settings have been completed, and we are ready to capture data to an ODS file.
If the data export module and the parser had been correctly set up, then you should see real-time drawing in OpenOffice/LibreOffice Calc (fig.8).
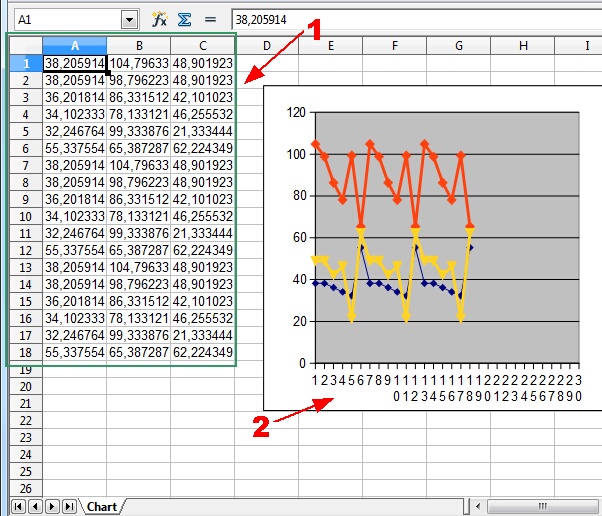
Fig.8. Charting in OpenOffice Calc
The figure above contains the following elements:
- The last 30 values of the parsed data;
- The diagram with plots.
The ODS file with all values and plots you can download here.
The backup copy of the configuration you may download here (Right click → Save As) and restore it from the "File" menu in the main window.
Related articles: Real-Time Serial Data Export and Charting in OpenOffice & LibreOffice Calc
Related topics: Advanced OPC Data Logger
hereOPC Logger RS232 pinout and signals Cables and signals Data monitor cables