
MODBUS Slave Emulator: Advanced Serial Port Monitor Plugin Guide
The Professional Solution for MODBUS Simulation
Testing a MODBUS master device (such as a PLC, SCADA system, or HMI) often requires a physical slave device. However, hardware can be expensive, inaccessible, or still in development. The MODBUS Slave Emulator plugin for Advanced Serial Port Monitor bridges this gap by turning your PC into a fully functional "digital twin" of a MODBUS hardware device.
The plugin supports both MODBUS RTU and MODBUS ASCII protocols and allows you to simulate Holding Registers, Input Registers, Coils, and Discrete Inputs.
Tutorial: Starting Your First Slave Emulation
Follow these steps to simulate a slave device on your COM port:
1. Configure the Physical Layer
Open Advanced Serial Port Monitor and select the COM port you wish to use. Ensure your baud rate and parity settings match your master device. Click the "Open" button. ASPM will connect to the selected COM port and start listening on it.
2. Enable the Plugin
Navigate to the Plugins menu and open the MODBUS ASCII/RTU slave and master simulation module.
3. Set Slave Parameters
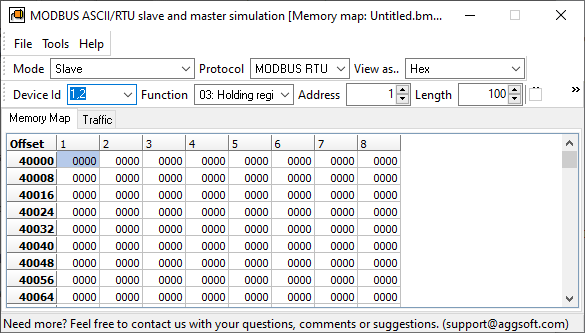
Using the interface (see the reference image below):
- Mode: Set to Slave.
- Protocol: Choose MODBUS RTU or ASCII.
- Device ID: Set the Slave ID (e.g.,
1). - Function: Choose the register type (e.g.,
03: Holding Registers). - Address & Length: Define your start address (e.g.,
1) and how many registers to simulate (e.g.,100). The plugin will report an exception code if a master requests data out of the specified range.
4. Populate the Memory Map
The grid labeled Memory Map represents the internal memory of your virtual device. You can also scan the device's memory map online.
- Double-click any cell to enter a value.
- Use the "View as" dropdown to change how data is displayed (Float, Unsigned decimal, Signed, Hex, etc.). If you change the data view mode, you can enter data in the selected format (not RAW register's values).
5. Monitor Traffic
Once your Master device begins polling, switch to the Traffic tab. Here, you can see the raw request/response packets in real-time, helping you debug timing issues or CRC errors.
MODBUS RTU Slave Not Responding? Find the Cause Before You Change Code
A slave that stays silent, answers with an exception or returns frames with a bad CRC looks the same from a PLC program or from your own master: a timeout. The plugin turns that timeout into a diagnosis, because it shows the exact request it sent and the exact bytes that came back, or the silence. Work through the four steps in order; each one rules out a layer.
1. Prove the wire with the device scan
Before you touch the master, open the MODBUS Device Scan plugin, set the address range and tick "If nothing found, try the next baud rate". A device that appears in the scan has correct wiring, a correct address and a speed you now know. A device that appears at no speed has a wiring, termination, ground or address problem, and no master software will fix it; the garbled serial data checklist lists those checks in order. Leave only one slave on the bus while you do this: two slaves with the same address answer together and corrupt each other's frames.
2. Poll one register as a master
Switch the plugin to Master mode with the address and speed from the scan, choose the function 03: Holding Registers, a start address of 0 or 1, a length of 1, and send. Then read the Traffic tab:
| What the Traffic tab shows | What it means | What to do |
|---|---|---|
| The request, then nothing until the timeout | The frame never reached the slave, or the reply never reached you: a half-duplex converter that switches direction late, A and B swapped, a wrong ID | Turn on the RS485 mode in the program if the converter needs the PC to switch direction; swap A and B; run the scan again |
| A reply whose function code is yours plus 0x80, followed by an exception byte | The slave heard you and refused: 01 illegal function, 02 illegal data address, 03 illegal data value | Read a register the device documents; some devices count registers from 0 and others from 1 |
| A reply with a CRC error, or shorter than expected | Bytes were corrupted or clipped on the way: baud rate, parity or stop bits off, missing terminator or common ground, a converter switching direction too late | Fix the settings, then the wiring; lower the speed as a test |
| A reply from a different slave ID | Two devices share the address, or the ID in the request is wrong | Readdress one device and scan the bus again |
| A correct reply | The device and the wire are fine; the fault is in the master | Go to step 3 |
3. Compare your master with a request that worked
If the device answers the plugin but not your PLC, HMI or program, the difference is in the frames or the timing. Close the plugin, switch Advanced Serial Port Monitor to Spy mode on the same port, start your master and compare its request byte by byte with the one that worked: slave ID, function code, start address (counted from 0 or from 1), register count, and the CRC with its low byte first. Pasted one per line into the MODBUS CRC calculator, both requests are decoded side by side and their CRCs checked. The timestamps show whether your master waits long enough for the reply or sends the next request too early; MODBUS RTU needs a silence of 3.5 character times between frames. The serial port sniffer page explains how Spy mode attaches without stopping the application.
4. Test the master without the device
When the device itself is missing or suspect, put the plugin into Slave mode with the same ID and register map and point your master at it, as described in the tutorial above. A master that reads the simulated slave correctly is ready for the real device; one that still fails has a configuration or protocol error you can now see in the Traffic tab.
Typical Usage Scenarios
1. HMI and SCADA Screen Development
Engineers can build entire HMI screens or SCADA dashboards before the actual PLC or sensors are installed on-site. By using the emulator, you can verify that every "tag" points to the correct register and that the scaling (e.g., converting a raw integer to a temperature) is functioning as expected.
2. Software Driver Validation
If you are developing a custom software application that acts as a MODBUS master, you need a reliable slave to test against. The emulator allows you to test how your software handles large data blocks, slow response times, unexpected register values, or other MODBUS errors without risking hardware damage.
3. Testing Error Handling and Exception Responses
A critical part of industrial reliability is knowing how a system reacts to errors. You can use the plugin to simulate MODBUS Exception Codes (like 01: Illegal Function or 02: Illegal Data Address). This allows you to verify that your master controller correctly identifies and logs faults rather than simply crashing or displaying "zero."
Expert Perspective: Data Integrity and Timing
In a professional MODBUS setting, this plugin isn't just a simple data transmitter. It translates data into register values, generates appropriate responses to master queries, and handles CRC and LRC checksum calculations on the fly.
One of the most powerful features for experts is the ability to save your Memory Map to a file (.mbmap). It lets you make "profiles" for various kinds of hardware. For example, you can have a "Power Meter Profile" and a "Temperature Controller Profile", switching between them in seconds to perform comprehensive system audits.
After testing, you can implement long-time MODBUS data logging system in your application.
See also
Identify Active Nodes: MODBUS Device Scan Plugin Guide
ASCII and Binary Device Emulation: Advanced Serial Port Monitor Plugins
Advanced Scripting and Macros
MODBUS Slave Emulator: Advanced Serial Port Monitor Plugin Guide
RS232 Analyzer from Advanced Serial Port Monitor
RS232 Monitor
RS232 Port Sniffer
Related topics: Advanced Serial Port Monitor
hereRS232 monitor RS232 analyzer COM Port Debug RS232 terminal Serial port sniffer Serial port spy UART monitor RS232 pinout and signals Data monitor cables.