
Advanced Serial Port Monitor Screenshots: Every Window Explained
Advanced Serial Port Monitor is a terminal, a sniffer and a test tool for COM, RS232 and RS485 ports on Windows. The screenshots below follow the order in which most people meet the program: the main window and the port settings, the ways to look at the data, logging, the spy mode that watches a port another program has open, and the MODBUS and automation plugins. Each window is shown with the problem it solves and a link to the guide that explains it; click a thumbnail to see it in full size.
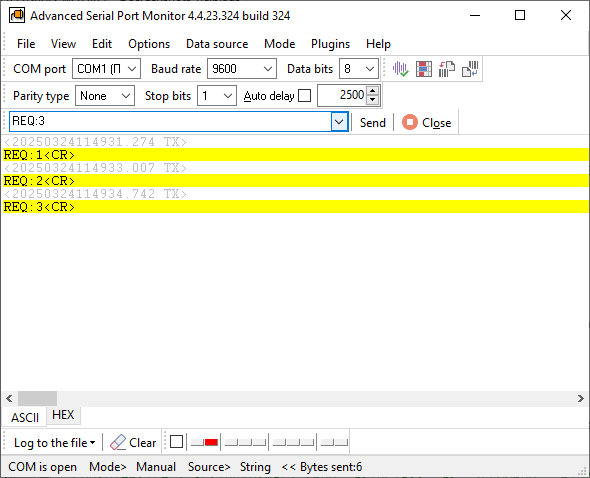
Main window: terminal mode
This is where a session starts. You pick a port on the toolbar, open it, type a command or send a file, and the reply appears in the window in ASCII and hex, with the direction of every packet and the time it arrived. The port is full duplex, so you can keep sending while a device streams data at you. Use it to find out whether a device answers at all and what it answers; the RS232 terminal guide walks through a first session.
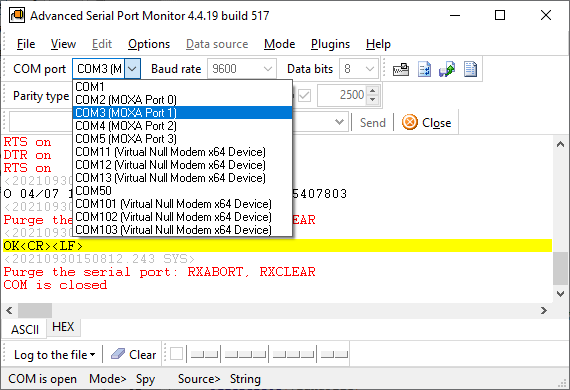
Serial port list
The program lists every COM port Windows knows about together with the device behind it: built-in ports, USB-to-serial adapters, Bluetooth links and virtual ports. That solves the usual first problem, which port number a device landed on after a driver update or a reboot, without opening Device Manager. The guide list all COM ports and find which one an application uses covers the other ways to answer that question.
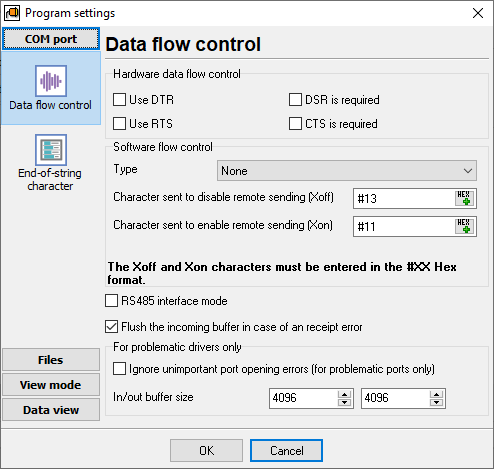
Port parameters and flow control
Baud rate, data bits, parity, stop bits and flow control are set here. Standard rates up to 921600 and user-defined rates are accepted, with 5 to 8 data bits, 1 to 2 stop bits, every parity type, and hardware (RTS/CTS) or software (XON/XOFF) flow control. All parameters can be changed while the port is open, so you can try the next combination without reconnecting. Wrong framing is the most common reason for unreadable data; garbled serial data: seven checks in order explains how to find the right settings.
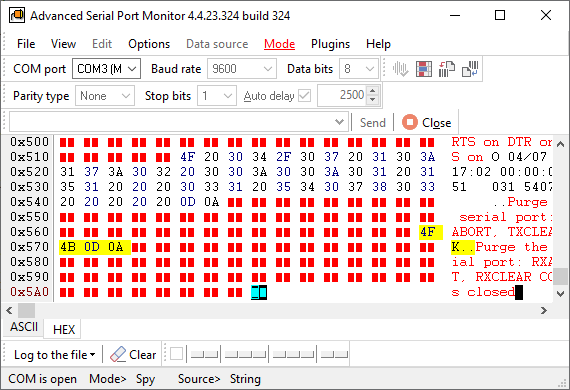
HEX data view
Binary protocols, checksums and control characters only make sense as bytes. The hex view shows every byte in order, so a frame can be compared with the device manual byte by byte, and a wrong CRC or a missing terminator is visible at once. The view can be switched at any time without closing the port. The video lesson hex data and timestamps shows it in use.

ASCII data view
Text protocols, such as the readings of a scale, a GPS receiver or a meter, are easier to read as text. The ASCII view shows the stream as lines, with control characters visible when you want them, so you can see where a device ends a record and what separates the fields. That is exactly what you need to know before you configure a parser or write your own code. See RS232 monitor for typical sessions.

Data view mode
These options decide how the incoming and outgoing data is laid out: as it arrives, byte by byte, or regrouped into packets, with the two directions in different colours. Packet view makes request and reply pairs easy to follow; raw view keeps the exact order of bytes when timing matters. The lesson manual and spy modes shows both views on real traffic.

Data formatting
Here you choose the representation of the data: hex, ASCII or binary, and how sent and received bytes are marked. Switching the format later does not lose anything, because the program keeps the raw bytes and only changes the display. When a protocol mixes text and binary fields, looking at the same packet in two formats is often the quickest way to decode it. The RS232 analyzer page has examples.

Timestamps
Every packet can carry a date and time stamp with millisecond precision, in the window and in the log file. Timing is where many serial problems hide: a device that answers 300 ms too late, a timeout that is set too short, a pause between two bytes that splits a frame. With stamps on both directions these pauses become visible and measurable. The guide COM port debugging uses them to find such faults.
Log files
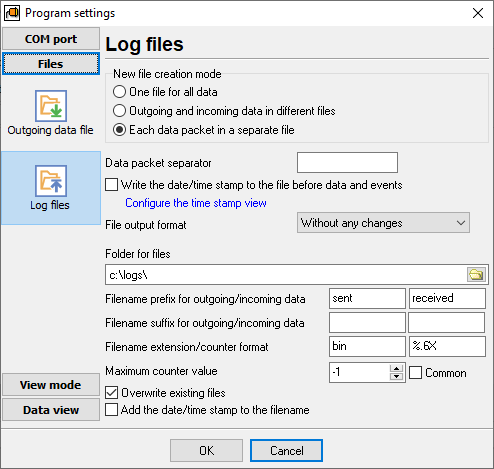
Everything received and sent can be written to a file, with timestamps and direction markers, while you watch it on screen. A log is the evidence you send to a vendor, the record you compare with the next day's session, and the input for the replay plugin, which plays a captured log back to a port with the original timing. The lesson log files and data from a file shows the settings.

Sending a file to the port
Instead of typing, the program can send the contents of a text or binary file: once, or on an interval from 10 ms to 10 s in automatic mode, logging the replies. A file with a prepared command set is a repeatable test; the same file sent on a timer is a soak test or a simple device simulator. How to send data to a COM port explains the options, including control characters and hex input.

Spy mode: events to record
In spy mode the program watches a port that another application already has open, without stopping it. This page selects which events of the port are recorded next to the data, for example when that application opens or closes the port or changes its settings. That answers questions like "does the program even open COM3?" or "which baud rate does it set?" before a single byte is exchanged. Read about the spy mode.
Sniffer: traffic of another program
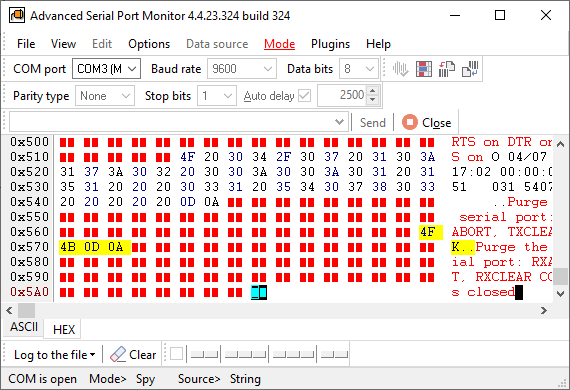
This is what a captured session looks like: both directions of the traffic between an application and its device, in order, with timestamps, taken from a port that the other program keeps using. No cable, second port or hardware analyzer is involved; the spy driver installs with the program. It is the way to recover an undocumented protocol from a working application, to check a driver, or to see why a vendor tool and a device do not get along. See the serial port sniffer guide.
MODBUS master and slave simulator
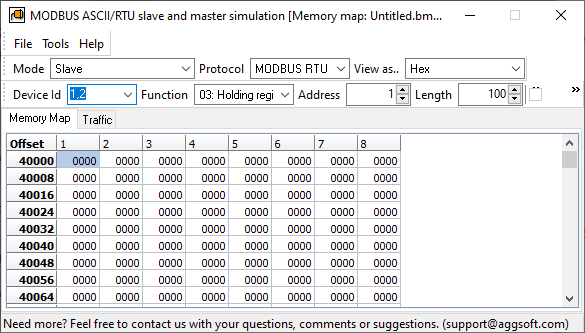
The MODBUS plugin ships with the program and works as an RTU or ASCII master and as a slave simulator. As a master it reads and writes coils and registers and shows the raw request and response next to the decoded values, which is how you verify a wiring change or a new device. As a simulator it emulates one or more slaves with the registers you define, so a PLC, HMI or your own master can be tested without hardware. The MODBUS plugin guide lists the function codes and modes.
MODBUS device scan
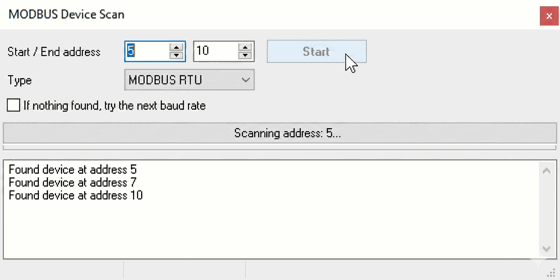
On an RS485 bus with several devices the first question is which slave addresses answer at all. The scan plugin polls a range of addresses and settings and lists the ones that reply, so you stop guessing slave IDs and baud rates. It is the quickest check after wiring a new meter or inverter. Details are on the device scan plugin page.
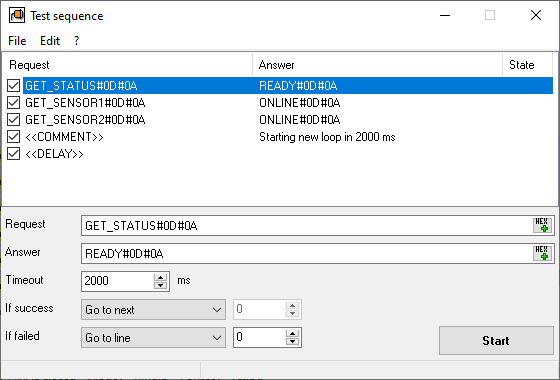
Test sequences
Bench work repeats. The Test Sequence plugin lets you define request and expected response pairs, run them in order and get a pass or fail per step, without writing a script. The same sequence can be run against a batch of devices and the results recorded, which turns an afternoon of manual typing into a few minutes. The guide automated hardware validation builds a sequence step by step.
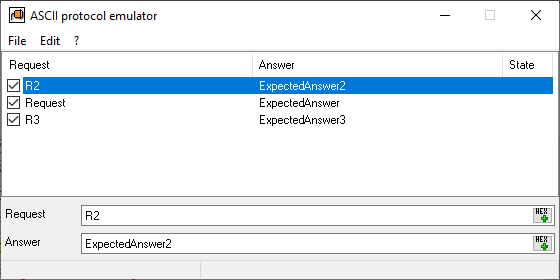
Device emulation
The ASCII and binary protocol simulation plugins answer defined requests with defined responses, so software can be developed and tested against a device that is not on the desk yet, or that is too expensive to keep on every workstation. Both plugins ship with source code and can be adapted to your protocol. See ASCII and binary device emulation.

Main window view settings
What the main window shows and how it is arranged is configurable: which panels are visible, how much data is kept on screen, and how the status line reports the port. On a long session with a chatty device these settings keep the window readable and the program responsive. The short video lessons show the typical setup.

Fonts and colours
Sent and received data, timestamps and events can each have their own colour, and the font is yours to choose. Colour-coded directions are what make a long capture readable at a glance: a request in one colour, the reply in another, a pause visible between them. The complete list of options is in the user manual (PDF).
The free trial is the full program, so every window above can be tried on your own port. The video lessons and the plugins page go further than a screenshot can.
Related topics: Advanced Serial Port Monitor
hereRS232 monitor RS232 analyzer COM Port Debug RS232 terminal Serial port sniffer Serial port spy UART monitor RS232 pinout and signals Data monitor cables.